Caesars Entertainment Reports Financial Results for the Third Quarter of 2018
Friday 02 de November 2018 / 12:07
⏱ 8 min read
(Las Vegas).- Caesars Entertainment Corporation today reported third quarter of 2018 results as summarized in the discussion below, which highlights certain GAAP and non-GAAP financial measures on a consolidated basis.

Third Quarter GAAP Highlights
- Third quarter net revenues increased $1.19 billion, from $0.99 billion to $2.19 billion, due to the inclusion of the results of CEOC, LLC ("CEOC"), which emerged from bankruptcy in the fourth quarter of 2017, and the inclusion of the results of Centaur Holdings, LLC ("Centaur"), which was acquired during the quarter.
- Third quarter operating profit increased 176%, or $148 million, from $84 million to $232 million.
- Third quarter net income attributable to Caesars was $110 million, compared to a net loss of $433 million in the prior year. Basic earnings per share totaled $0.16.
- Caesars Entertainment completed the acquisition of Centaur on July 16, 2018.
- Caesars Entertainment increased its Share Repurchase Program authorization to $750 million and repurchased approximately 28 million shares during the quarter for approximately $280 million.
Enterprise-wide Highlights (Non-GAAP)
- Enterprise-wide net revenues increased 2.9%, or $62 million, from $2.12 billion to $2.19 billion. Enterprise-wide hold adjusted net revenues increased 2.2%, or $48 million, from $2.16 billion to $2.21 billion.
- Enterprise-wide adjusted EBITDAR decreased 2.1%, or $13 million, from $613 million to $600 million. Enterprise-wide hold adjusted EBITDAR decreased 2.7%, or $17 million, from $633 million to $616 million.
- Enterprise-wide and Las Vegas adjusted EBITDAR were both approximately flat to down 1% on a year over year basis when adjusting for hold and a favorable credit in bad debt expense.
- Enterprise-wide adjusted EBITDAR margin declined 140 basis points to 27.5%. Despite headwinds in Las Vegas, our Las Vegas adjusted EBITDAR margin was 33.7%.
- Excluding Centaur, marketing costs decreased 10.0%, or $57 million, including $32 million of contra-revenue, reflecting the Company's continued focus in this area.
"We executed well during the quarter despite a challenging operating environment in Las Vegas and Atlantic City, and we are optimistic about the opportunities ahead," said Mark Frissora, President & Chief Executive Officer. "Third quarter net income was $110 million compared to a loss of $433 million in the prior year period, benefiting from the consolidation of CEOC and acquisition of Centaur. Despite soft demand in Las Vegas during the third quarter, our booking pace is up meaningfully in the fourth quarter and we expect to deliver approximately 4% to 6% adjusted EBITDAR growth for the full year. Our results demonstrated continued broad-based strength across our regional properties and momentum in our operational efficiency efforts. Our performance this quarter shows the benefits of our portfolio approach and the balance between destination and regional assets."
Mr. Frissora continued, "We are making important progress against our growth strategy with the integration of Centaur, expansion of our U.S. sports betting business and the creation or renewal of partnerships with six professional sports organizations. We have the right strategies in place and are confident in our ability to create value for shareholders over the long-term, as evidenced by our repurchase of $311 million in shares year to date."
Additional Development
Recently, the Company received a letter from Golden Nugget, LLC proposing that Caesars acquire substantially all of Golden Nugget's restaurant, hospitality, entertainment and gaming businesses in exchange for a significant minority of Caesars' common shares.
The Board considered the proposal, in consultation with its legal and financial advisors, and determined that it is not consistent with the Company's plans to create and enhance shareholder value over the long term. The Board has informed Golden Nugget of its decision.
Consistent with its fiduciary duties, the Board continues to be open to reasonable alternatives to enhance long-term shareholder value.
Basis of Presentation
In accordance with U.S. GAAP, the results of CEOC and certain of its U.S. subsidiaries were not consolidated with Caesars from January 15, 2015 until October 6, 2017. Additionally, Caesars deconsolidated the results of its Horseshoe Baltimore property in the third quarter of 2017. Note that certain additional non-GAAP financial measures have been added to highlight the results of the Company including CEOC. "Enterprise-wide" results reported herein include CEOC as if its results were consolidated during all periods, but remove the deconsolidated Horseshoe Baltimore property from all periods presented. On July 16, 2018, Caesars completed the acquisition of Centaur. "2018 Data Excluding Centaur" removes the post-acquisition results of Centaur from Caesars' consolidated results. See the tables at the end of this press release for the reconciliation of non-GAAP to GAAP presentations. GAAP and Enterprise-wide results include Caesars Acquisition Company ("CAC") for all periods presented because CEC's merger with CAC was accounted for as a reorganization of entities under common control. The intent of the Enterprise-wide information is to illustrate certain comparable results based on the current consolidation structure. For Enterprise-wide result reconciliations by region, see the historical information supplement in the Investor Relations section of www.caesars.com.
Caesars also adopted ASC 606: Revenue from Contracts with Customers, effective January 1, 2018, using the full retrospective method, which requires the Company to recast each prior reporting period presented consistent with the new standard.
See Supplemental Information in this release for information regarding our forecasted adjusted EBITDAR growth and why we are unable to reconcile it to GAAP.
Financial Results
Caesars views each casino property as an operating segment and aggregate such casino properties into three regionally-focused reportable segments: (i) Las Vegas, (ii) Other U.S. and (iii) All Other, which is consistent with how Caesars manages the business. The results of our reportable segments presented below are consistent with the way management assesses these results and allocates resources, which is a consolidated view that adjusts for the effect of certain transactions among reportable segments within Caesars. "All Other" includes managed, international and other properties as well as parent and other adjustments to reconcile to consolidated Caesars results.
Net Revenues (1) | |||||||||||||||||||||||||||||
| Enterprise-wide | ||||||||||||||||||||||||||||
(Dollars in millions) | 2018 | 2017 | $ Change | % Change | 2018 | 2017 | $ Change | % Change | |||||||||||||||||||||
Las Vegas | $ | 910 | $ | 687 | $ | 223 | 32.5% | $ | 910 | $ | 932 | $ | (22) | (2.4)% | |||||||||||||||
Other U.S. | 1,125 | 284 | 841 | ** | 1,125 | 1,038 | 87 | 8.4% | |||||||||||||||||||||
All Other | 150 | 22 | 128 | ** | 150 | 153 | (3) | (2.0)% | |||||||||||||||||||||
Caesars | $ | 2,185 | $ | 993 | $ | 1,192 | 120.0% | $ | 2,185 | $ | 2,123 | $ | 62 | 2.9% | |||||||||||||||
_____________________ |
(1) See the Reconciliation of Net Income/(Loss) Attributable to Caesars Entertainment Corporation to Adjusted EBITDAR, which includes a reconciliation for Enterprise-wide net revenues and adjusted EBITDAR. |
** Percentage is not meaningful. |
The inclusion of CEOC's and Centaur's results increased CEC net revenues by $1.19 billion. The year-over-year comparison is not meaningful due to the magnitude of consolidating CEOC's portfolio.
Enterprise-wide net revenues improved $62 million driven primarily by an $87 million increase in Other U.S. revenues resulting from the acquisition of Centaur. Excluding Centaur, Other U.S. net revenues were $1.02 billion for the third quarter of 2018, a decrease of $18 million from 2017 primarily due to increased competition in Atlantic City. Las Vegas net revenues decreased $22 million primarily due to weaker demand in the leisure segment from a citywide lack of events and conventions in the quarter and unfavorable hold. Las Vegas ADR remained flat while RevPAR decreased 3.6%. Las Vegas occupancy was 92.8% in the quarter, down from 96.1% in 2017. All Other net revenues remained essentially flat year over year.
Hold had a favorable impact of $10 million to $14 million compared to the prior year and was $20 million to $25 million below our expectations.
Income/(Loss) from Operations | ||||||||||||||||||||||
| Enterprise-wide | |||||||||||||||||||||
(Dollars in millions) | 2018 | 2017 | $ Change | % Change | 2018 | 2017 | $ Change | % Change | ||||||||||||||
Las Vegas | $ | 141 | $ | 107 | $ | 34 | 31.8% | * | * | * | * | |||||||||||
Other U.S. | 172 | 47 | 125 | ** | * | * | * | * | ||||||||||||||
All Other | (81) | (70) | (11) | (15.7)% | * | * | * | * | ||||||||||||||
Caesars | $ | 232 | $ | 84 | $ | 148 | 176.2% | * | * | * | * | |||||||||||
_____________________ |
* Adjustments to property, plant, and equipment ("PP&E") at emergence distorts year-over-year comparability of Enterprise-wide income/(loss) from operations. |
** Percentage is not meaningful. |
The consolidation of CEOC's results contributed $104 million to income from operations while the post-acquisition results of Centaur contributed $22 million to income from operations in 2018, partially offset by a decrease of $6 million in income from operations due to the deconsolidation of Horseshoe Baltimore's results subsequent to August 31, 2017. Excluding CEOC, Centaur and Horseshoe Baltimore, income from operations increased $28 million primarily as a result of lower accelerated depreciation in 2018 compared with 2017 due to the removal and replacement of certain assets in connection with ongoing property renovation projects and nonrecurring charges in the prior year to exit the fully bundled sales system of NV Energy, partially offset by a decrease in net revenues in the Las Vegas region as discussed above.
Net Income/(Loss) Attributable to Caesars | ||||||||||||||||||||||
| Enterprise-wide | |||||||||||||||||||||
(Dollars in millions) | 2018 | 2017 | $ Change | % Change | 2018 | 2017 | $ Change | % Change | ||||||||||||||
Las Vegas | $ | 58 | $ | 107 | $ | (49) | (45.8)% | * | * | * | * | |||||||||||
Other U.S. | 35 | 70 | (35) | (50.0)% | * | * | * | * | ||||||||||||||
All Other | 17 | (610) | 627 | ** | * | * | * | * | ||||||||||||||
Caesars | $ | 110 | $ | (433) | $ | 543 | ** | * | * | * | * | |||||||||||
_____________________ |
* Adjustments to PP&E, debt, and the financial obligation at emergence distorts year-over-year comparability of Enterprise-wide net income/(loss). |
** Percentage is not meaningful. |
In addition to the $148 million increase in income from operations discussed above, nonrecurring restructuring expenses of approximately $448 million in 2017 primarily drove the year-over-year fluctuation in net income/(loss) attributable to Caesars. In 2018, we also benefitted from other income of $97 million due to a change in the fair value of the derivative liability related to the conversion option of CEC's 5.00% convertible senior notes maturing in 2024 (the "CEC Convertible Notes") as well as an increase of $66 million in our income tax benefit primarily due to the deferred tax benefit in 2018 from the partial release of the federal valuation allowance upon the acquisition of Centaur. These increases were partially offset by an increase of $221 million in interest expense primarily as a result of our failed sale-leaseback financing obligations with VICI Properties Inc. ("VICI") that began incurring interest in the fourth quarter of 2017.
Adjusted EBITDAR (1) | |||||||||||||||||||||||||||||
| Enterprise-wide | ||||||||||||||||||||||||||||
(Dollars in millions) | 2018 | 2017 | $ Change | % Change | 2018 | 2017 | $ Change | % Change | |||||||||||||||||||||
Las Vegas | $ | 307 | $ | 235 | $ | 72 | 30.6% | $ | 307 | $ | 332 | $ | (25) | (7.5)% | |||||||||||||||
Other U.S. | 310 | 74 | 236 | ** | 310 | 280 | 30 | 10.7% | |||||||||||||||||||||
All Other | (17) | (5) | (12) | ** | (17) | 1 | (18) | ** | |||||||||||||||||||||
Caesars | $ | 600 | $ | 304 | $ | 296 | 97.4% | $ | 600 | $ | 613 | $ | (13) | (2.1)% | |||||||||||||||
_____________________ |
(1) See the Reconciliation of Net Income/(Loss) Attributable to Caesars Entertainment Corporation to Adjusted EBITDAR, which includes a reconciliation for Enterprise-wide net revenues and adjusted EBITDAR. |
** Percentage is not meaningful. |
Enterprise-wide adjusted EBITDAR declined $13 million, primarily as a result of lower hotel revenues in the Las Vegas region and increased competition in Atlantic City. Excluding Centaur, Other U.S. adjusted EBITDAR was $278 million for the third quarter of 2018, which was relatively flat as compared to 2017 despite the decrease in revenues which were offset by marketing and labor efficiency improvements. All Other adjusted EBITDAR decreased by $18 million year over year due to higher non-recurring corporate costs in the prior year and lower than normal insurance expense in the prior year due to large claims that settled significantly lower than reserved.
Hold had a favorable impact of $0 to $5 million compared to the prior year and was $15 million to $20 million below our expectations.
Cash and Available Revolver Capacity
(In millions) | September 30, 2018 | ||
Cash and cash equivalents | $ | 1,563 | |
Revolver capacity | 1,200 | ||
Revolver capacity drawn or committed to letters of credit | (186) | ||
Total Liquidity | $ | 2,577 | |
Conference Call Information
Caesars Entertainment Corporation (NASDAQ: CZR) will host a conference call at 2:30 p.m. Pacific Time, Thursday, November 1, 2018, to discuss its third quarter results, certain forward-looking information and other matters related to Caesars Entertainment Corporation, including certain financial and other information. The press release, webcast, and presentation materials will be available on the Investor Relations section of www.caesars.com.
If you would like to ask questions and be an active participant in the call, you may dial 877-637-3723, or 832-412-1752 for international callers, and enter Conference ID 4894346 approximately 10 minutes before the call start time. A recording of the live call will be available on the Company's website for 90 days after the event. Supplemental materials have been posted on the Caesars Entertainment Investor Relations website at http://investor.caesars.com/events-and-presentations.
Categoría:Casino
Tags: Caesars Entertainment,
País: United States


Event
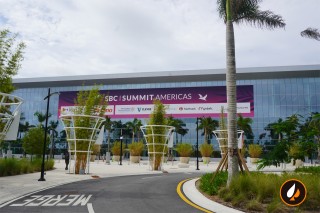


SBC Summit Americas 2026
09 de June 2026
Belatra Games Highlights Networking Value at SBC Summit Americas 2026
(Fort Lauderdale, SoloAzar Exclusive).- Lucila M. Barletta, Head of Accounts LatAm at Belatra Games, shared her insights on the company’s participation at SBC Summit Americas. From strengthening partnerships to exploring new opportunities, she emphasized the importance of both large industry events and smaller networking experiences in driving meaningful business growth.
Friday 03 Jul 2026 / 12:00
Zenith Strengthens LATAM Presence at SBC Summit Americas
(Fort Lauderdale, SoloAzar Exclusive).- In conversation with SoloAzar, Eddie Morales, Zenith's Business Development Manager, shared the company’s objectives at SBC Summit Americas, the opportunities generated, and the outlook on the future of the gaming industry in Latin America.
Friday 03 Jul 2026 / 12:00
LSports LATAM Secures Major Partnerships at SBC Summit Americas 2026
(Fort Lauderdale, SoloAzar Exclusive).- In Q&A after SBC Summit Americas 2026, Fernando Martinez, representative of LSports LATAM, talked about the company’s goals, achievements, and future plans in the region. Martinez shares insights on the evolving dynamics of the Latin American market, the importance of strategic partnerships, and how LSports is positioning itself as a leading data and trading services provider.
Wednesday 01 Jul 2026 / 12:00
SUSCRIBIRSE
Para suscribirse a nuestro newsletter, complete sus datos
Reciba todo el contenido más reciente en su correo electrónico varias veces al mes.