The Stars Group Files Business Acquisition Report and Provides Supplemental Information for Sky Betting & Gaming
⏱ 16 min read
(Toronto).- The Stars Group Inc. (NASDAQ :TSG )(TSX :TSGI ) today filed a business acquisition report with respect to its acquisition of Sky Betting & Gaming ("SBG") and is providing certain supplemental historic financial information and additional highlights and updates for SBG. The business acquisition report includes, among other information, SBG's audited financial statements for its fiscal year ended June 30, 2018, as well as certain pro forma unaudited financial statements and information of The Stars Group. Unless otherwise noted, all dollar ($) amounts are in U.S. dollars and all references to "£" and "Pound Sterling" are to Great Britain pound sterling.

"2018 is a transformative year for the business, with three acquisitions and related financings and other significant changes to our corporate and capital structure," said Rafi Ashkenazi, The Stars Group's Chief Executive Officer. "We've executed on these transactions and looking forward into 2019, are now focused on integration and we are confident that we will deliver on our plans to grow market share both globally and in key markets. SBG is a key component of this plan and we are excited about its potential as the fastest growing and one of the largest online and mobile sports betting and gaming businesses in the UK, the world's largest regulated online gaming market," concluded Mr. Ashkenazi.
"The 2018 fiscal year was another strong year for SBG, with continued product leadership and innovation," said Richard Flint, Chief Executive Officer of SBG. "We enjoyed another year of growth, extending our leadership as the UK's most popular online betting and gaming brand. We also continued our investment in brand, technology and people, and continued delivering innovative products that meet the needs of our customers, all of which we believe combined to drive strong operating results," continued Mr. Flint.
"I am also particularly pleased with the progress we made to deliver a safer gambling environment to our customers and to continue our record of job creation and investment in Yorkshire, as well as our contribution to regional and national taxation in the UK," said Mr. Flint.
"The transaction with The Stars Group will allow us to offer our best-in-class products to a truly global audience. We enter the rest of 2018 and head into 2019 as part of one of the world's largest publicly listed online gaming companies, and I am excited about the opportunities that this combination presents," concluded Mr. Flint.
SBG Fiscal Year 2018 Financial Summary
Fiscal year ended June, | ||||||||||||
In thousands of Pound Sterling (except percentages or otherwise noted) | 2018 | 2017 | % Change | |||||||||
Stakes (millions) | 3,859 | 3,417 | 13% | |||||||||
Betting Net Win Margin (%) | 10.5% | 8.7% | 1.8 ppts | |||||||||
Betting revenue | 406,510 | 297,399 | 36.7% | |||||||||
Gaming revenue | 239,244 | 200,949 | 19.1% | |||||||||
Other revenue | 24,712 | 17,417 | 41.9% | |||||||||
Total revenue | 670,466 | 515,765 | 30.0% | |||||||||
Gross profit | 500,132 | 375,533 | 33.2% | |||||||||
Operating profit | 86,719 | 68,574 | 26.5% | |||||||||
Net loss | (15,282) | (5,995) | 154.9% | |||||||||
Adjusted EBITDA ¹ | 208,623 | 145,812 | 43.1% | |||||||||
Adjusted EBITDA Margin ¹ | 31.1% | 28.3% | 2.8 ppts | |||||||||
Net cash flows from operating activities | 200,584 | 141,751 | 41.5% | |||||||||
Capital Expenditure | 28,233 | 32,673 | (13.6%) | |||||||||
SBG Fiscal Year 2018 Quarterly Financial Summary
Fiscal quarter ended September, | Fiscal quarter ended December, | |||||||||||||||||||||||
In millions of Pound Sterling (except percentages or otherwise noted) | 2017 | 2016 | % Change | 2017 | 2016 | % Change | ||||||||||||||||||
Stakes (millions) | 923 | 686 | 35% | 910 | 731 | 24% | ||||||||||||||||||
Betting Net Win Margin (%) | 9.0% | 10.2% | (1.2)ppts | 14.0% | 8.6% | 5.4ppts | ||||||||||||||||||
Revenue | ||||||||||||||||||||||||
Betting | 83 | 70 | 18% | 128 | 63 | 103% | ||||||||||||||||||
Gaming | 58 | 43 | 35% | 59 | 46 | 28% | ||||||||||||||||||
Other | 5 | 4 | 25% | 6 | 4 | 53% | ||||||||||||||||||
Total Revenue | 146 | 117 | 25% | 193 | 113 | 71% | ||||||||||||||||||
Gross Profit | 109 | 86 | 26% | 147 | 83 | 78% | ||||||||||||||||||
Gross Profit Margin (%) | 74% | 74% | 0.6ppts | 76% | 73% | 3.1ppts | ||||||||||||||||||
Operating Profit | 24 | 22 | 7% | 58 | 5 | 960% | ||||||||||||||||||
Adjusted EBITDA ¹ | 42 | 39 | 9% | 77 | 23 | 230% | ||||||||||||||||||
Adjusted EBITDA Margin (%) ¹ | 28.6% | 32.8% | (4.2)ppts | 39.7% | 20.5% | 19.2ppts | ||||||||||||||||||
Quarterly Active Uniques (QAUs) (millions) | 1.6 | 1.3 | 21% | 1.6 | 1.3 | 19% | ||||||||||||||||||
Quarterly Net Yield (QNY) (£) | 88 | 86 | 2% | 116 | 81 | 43% | ||||||||||||||||||
Fiscal quarter ended March, | Fiscal quarter ended June, | |||||||||||||||||||||||
In millions of Pound Sterling (except percentages or otherwise noted) | 2018 | 2017 | % Change | 2018 | 2017 | % Change | ||||||||||||||||||
Stakes (millions) | 1,005 | 933 | 8% | 1,022 | 1,068 | (4%) | ||||||||||||||||||
Betting Net Win Margin (%) | 9.2% | 8.2% | 1.0ppts | 10.2% | 8.3% | 1.9ppts | ||||||||||||||||||
Revenue | ||||||||||||||||||||||||
Betting | 92 | 76 | 21% | 104 | 88 | 18% | ||||||||||||||||||
Gaming | 59 | 54 | 10% | 63 | 58 | 8% | ||||||||||||||||||
Other | 6 | 3 | 74% | 8 | 6 | 29% | ||||||||||||||||||
Total Revenue | 157 | 133 | 18% | 174 | 152 | 15% | ||||||||||||||||||
Gross Profit | 116 | 96 | 21% | 128 | 111 | 16% | ||||||||||||||||||
Gross Profit Margin (%) | 74% | 72% | 2.1ppts | 74% | 73% | 0.9ppts | ||||||||||||||||||
Operating Profit (Loss) | 19 | 13 | 47% | (15) | 28 | (152%) | ||||||||||||||||||
Adjusted EBITDA ¹ | 38 | 32 | 21% | 52 | 52 | (1%) | ||||||||||||||||||
Adjusted EBITDA Margin (%) ¹ | 24.3% | 23.7% | 0.6ppts | 29.8% | 34.5% | (4.6)ppts | ||||||||||||||||||
QAUs (millions) | 1.8 | 1.6 | 10% | 2.0 | 1.7 | 16% | ||||||||||||||||||
QNY (£) | 83 | 79 | 5% | 83 | 85 | (2%) | ||||||||||||||||||
__________________________________________________ |
1 Non-IFRS measure. For important information on SBG's non-IFRS measures, see below under "Non-IFRS Measures" and the tables under "Reconciliation of Non-IFRS Measures to Nearest IFRS Measures". |
SBG Fiscal Year 2018 and Subsequent Financial Highlights
- Total Revenues – Revenues for the year increased 30% year-over-year to £670 million. All segments contributed to the revenue growth.
- Betting Revenues – Betting revenue for the year was £407 million, or an increase of 37% year-over-year, primarily the result of increased Stakes and Betting Net Win Margin. Stakes growth was primarily driven by product enhancement and innovation, with Betting Net Win Margin primarily influenced by a sustained run of operator-favorable sporting results, particularly with respect to European football. SBG betting revenue includes revenue from real-money online sports betting products.
- Gaming Revenues – Gaming revenue for the year was £239 million, or an increase of 19% year-over-year, primarily the result of ongoing product innovation as noted below, continued strong promotions, and further exclusive content launches. SBG gaming revenue includes revenue from real-money online poker, casino and bingo products.
- Adjusted EBITDA and Adjusted EBITDA Margin – Adjusted EBITDA for the year was £209 million, or an increase of 43% year-over-year. The increase was primarily driven by increased total revenue as noted above, which was partially offset by a 25% year-over-year increase in total operating costs (excluding depreciation, amortization and transaction-related costs). Adjusted EBITDA Margin for the year increased by 2.8 percentage points year-over-year to 31%, primarily the result of improvements related to the increased scale of the business, including more efficient payment processing and content sourcing, as well as the flow-through of revenues from the sustained run of operator-favorable sporting results to Adjusted EBITDA. Staff costs increased broadly in line with revenue as the business continued to invest in technology, product and content, while marketing costs increased by 23%, below revenue growth, with the marketing to revenue ratio decreasing from 23% to 22% as a result of more efficient marketing spend and the impact of the operator-favorable sporting results in the period.
SBG Fiscal Year 2018 and Subsequent Operational Highlights
- Stakes and Betting Net Win Margin – Stakes increased 13% year-over-year, while Betting Net Win Margin increased 1.8 percentage points year-over-year. While variability in sports results is a natural factor in a sports betting business, SBG's fiscal year 2018 saw a sustained run of operator-favorable sporting results, particularly on European football, resulting in its Betting Net Win Margin for the year being 10.5% as compared to its expected level of approximately 9%.
- Quarterly Active Uniques (QAUs) – Average QAUs were 1.8 million, which represents an increase of 17% year-over-year. This increase was primarily the result of market share gains driven by product enhancements and new products, leading SBG to hold its position as the most popular online and mobile sports betting and gaming brand in the UK. For example, during the past year, SBG introduced the following product and promotional innovations and enhancements:
- "Soccer Saturday Super Boost", which gives customers superior pricing on the top teams and is part of a broader marketing and customer engagement plan to enhance loyalty
- "MyBets", which gives customers a quick, simple and intuitive way to track all their bets, including live tracking of SBG's popular "RequestABet" product
- "Bonus Time", which is SBG exclusive content that leverages its real time data capability and control of its front-end technology to randomly award players bonus games if they play on Sky Vegas during certain times.
- "Fast Withdrawals", which gives customers the ability to receive their withdrawals almost instantly. This feature was initially rolled out in partnership with one UK national bank and could be expanded to more banks and customers in the future.
- "ITV7", which is a horse racing prediction game that SBG launched in partnership with ITV, the largest commercial terrestrial TV channel in the UK. The product leverages SBG's expertise in free-to-play games, generates engaging content for ITV's racing show, provides a chance to win life-changing prizes for free, and creates a new source of customer acquisition and retention for SBG.
- Quarterly Net Yield (QNY) – Average QNY was £93, an increase of 12% year-over-year. The increase was primarily a result of increased Betting Net Win Margin.
- World Cup 2018 – SBG experienced a successful World Cup with 1.3 million active unique customers on its sportsbook, generating revenue (before any offsets for bonuses, promotions or incentives) of approximately £33 million across the tournament. A majority of such revenue was generated prior to The Stars Group's acquisition of SBG on July 10, 2018 and thus will not be included in The Stars Group's consolidated results for the third quarter of 2018.
- Safer Gambling – During the year, SBG accelerated investments in the business to promote a safer betting and gaming environment for its customers. This included enhanced use of customer data, increased promotion and accessibility of self-help tools, greater interaction with customers and increased interventions, including through appropriate blocking or limiting of play. SBG believes these investments will deliver long-term benefits and support ongoing market share gains, despite the negative impact of the same on SBG's revenues during the past year.
SBG Fiscal Year 2018 Quarterly Financial and Operational Highlights
- First Quarter: Revenues for the first quarter increased to £146 million, primarily driven by an increase in betting revenues and gaming revenues of 18% and 35% year-over-year, respectively. The increase in betting revenues was primarily due to strong customer growth resulting from a successful customer retention campaign at the start of the European football season, including the launch of "Soccer Saturday Super Boost". The increase in gaming revenues was primarily the result of strong cross selling from betting into gaming, coupled with the launches of new products, content and promotions. Adjusted EBITDA for the first quarter increased 9% year-over-year to £42 million, with Adjusted EBITDA Margin for the same period decreasing by 4.2 percentage points year-over-year primarily due to higher than normal Betting Net Win Margin in the comparative period and increased investment in promotions at the start of the 2018 European football season.
- Second Quarter: Revenues for the second quarter increased to £193 million, primarily driven by an increase in betting revenues and gaming revenues of 103% and 28% year-over-year, respectively. The increase in betting revenues was primarily due to Stakes growth of 24% and a sustained run of operator-favorable sports results, particularly within European football, resulting in a Betting Net Win Margin for the period of 14%, which was approximately 50% above SBG's normal expected level. The increase in gaming revenues was primarily driven by strong player volumes and cross-selling, together with promotions and new content. Adjusted EBITDA for the second quarter increased by 230% year-over-year to £77 million, primarily due to the high Betting Net Win Margin noted above, and decreased marketing costs, as these were phased more towards the first quarter and the start of the European football season. Adjusted EBITDA Margin for the same period increased by over 19 percentage points year-over-year as the cost base is more closely managed to player volumes and activity, rather than revenue, meaning the increased Betting Net Win Margin during the period had a significant flow-through impact on Adjusted EBITDA.
- Third Quarter: Revenues for the third quarter increased to £157 million, primarily driven by an increase in betting revenues and gaming revenues of 21% and 10% year-over-year, respectively. The increase in betting revenues was primarily due to Stakes growth of 8%, and an increase in Betting Net Win Margin to 9.2%, which is closer to expected levels. The Stakes growth rate was lower than it has been in previous quarters primarily due to the impact of the sustained run of operator-favorable sports results noted above resulting in customers having smaller account balances. The increase in gaming revenues was primarily due to continued product and promotion enhancements, but was partially offset by lower cross-selling due to, among other things, the impact of the prior quarter's run of sporting results and SBG's safer gambling initiatives. Adjusted EBITDA for the third quarter increased to £38 million, with Adjusted EBITDA Margin for the same period remaining relatively stable, with ongoing investment in brand, technology and people offsetting some operational leverage from the revenue growth.
- Fourth Quarter: Revenues for the fourth quarter increased to £174 million, primarily driven by an increase in betting revenues and gaming revenues of 18% and 8% year-over-year, respectively. The increase in betting revenues was primarily due to continued strong customer growth, the first 14 days of the World Cup and higher year-over-year Betting Net Win Margin. Despite strong customer growth, Stakes were 4% lower year-over-year primarily due to lower Stakes per player as customers continued to feel the effects of the run of sporting results noted above, as well as the comparative period including a vibrant end to the previous European football season. The increase in gaming revenues was primarily due to the same reasons as noted for the third quarter. Adjusted EBITDA for the fourth quarter was relatively flat at £52 million, with Adjusted EBITDA Margin for the same period decreasing 4.6 percentage points year-over-year as SBG invested heavily in marketing ahead of the World Cup, with the comparative period having lower marketing spend due to a lack of major sporting tournaments or events during such period.
2018 Full Year Guidance
- Full Year Guidance –The Stars Group continues to expect the following 2018 full year financial guidance ranges:
- Revenues of between $1.995 and $2.145 billion;
- Adjusted EBITDA of between $755 and $810 million;
- Adjusted Net Earnings of between $485 and $545 million;
- Adjusted Net Earnings per Diluted Share of between $1.99 and $2.22; and
- Capital Expenditures of between $110 and $150 million.
- Full Year Pro Forma Guidance – The Stars Group is also providing certain pro forma 2018 full year financial guidance ranges on a consolidated basis to reflect the SBG and Australian acquisitions (CrownBet and William Hill Australia, now collectively known as BetEasy) as if they had been consolidated from January 1, 2018:
- Revenues of between $2.537 and $2.687 billion;
- Adjusted EBITDA of between $897 and $952 million; and
These unaudited expected results reflect management's view of current and future market and business conditions, including assumptions of (i) expected Betting Net Win Margin of between 8.0% and 10.5%, (ii) continued negative operating conditions in Poland and potential negative operating conditions in Russia resulting from prior regulatory changes, including constraints on payment processing, (iii) no other material regulatory events or investments associated with the entry into new markets, (iv) no impact from the gaming advertising ban in Italy, and (v) no material foreign currency exchange rate fluctuations, particularly against the Euro, Great Britain pound sterling and Australian dollar. Such guidance is also based on a Euro to U.S. dollar exchange rate of 1.17 to 1.00, a Great Britain pound sterling to U.S. dollar exchange rate of 1.32 to 1.00 and an Australian dollar to U.S. dollar exchange rate of 0.74 to 1.00, and the Proforma 2018 Guidance includes pre-acquisition actual results using historical foreign exchange rates and forward guidance post-acquisition for each of the three acquisitions using the foreign exchange rates in the assumptions above. Such guidance is also based on Diluted Shares of between 241,000,000 and 243,000,000 for the high and low ends of the Adjusted Diluted Net Earnings per Share range, respectively, and certain accounting assumptions.
Capital Expenditures include estimated spend on intangible assets, property, plant and equipment and certain development costs.
Business Acquisition Report and Additional Information
The Stars Group's business acquisition report with respect to its acquisition of SBG, as well as additional information relating to The Stars Group, SBG and their businesses, can be found on SEDAR at www.sedar.com, Edgar at www.sec.gov and The Stars Group's website at www.starsgroup.com.
In addition to press releases, securities filings and public conference calls and webcasts, The Stars Group intends to use its investor relations page on its website as a means of disclosing material information to its investors and others and for complying with its disclosure obligations under applicable securities laws. Accordingly, investors and others should monitor the website in addition to following The Stars Group's press releases, securities filings and public conference calls and webcasts. This list may be updated from time to time.
Investor Conference Call and Webcast
The Stars Group will host an investor conference call today, September 17, 2018 at 8:30 a.m. ET to discuss the information presented in this news release and the business acquisition report. To access via tele-conference, please dial +1 877-451-6152 or +1 201-389-0879 ten minutes prior to the scheduled start of the call. The playback will be made available two hours after the event at +1 844-512-2921 or +1 412-317-6671. The Conference ID number is 13683167. To access the webcast please use the following link: http://public.viavid.com/index.php?id=131264
Reconciliation of Non-IFRS Measures to Nearest IFRS Measures
The tables below present reconciliations of Adjusted EBITDA of SBG to operating profit, which is the nearest IFRS measure:
Fiscal quarter ended | ||||||||||||||||||||||||
September | September | December | December | March | March | June | June | |||||||||||||||||
In millions of Pound Sterling | 2017 | 2016 | 2017 | 2016 | 2018 | 2017 | 2018 | 2017 | ||||||||||||||||
Operating profit | 23.7 | 22.2 | 58.1 | 5.5 | 19.5 | 13.2 | (14.5) | 27.7 | ||||||||||||||||
Depreciation and amortization | 18.2 | 16.3 | 18.4 | 17.7 | 18.8 | 18.5 | 17.8 | 18.4 | ||||||||||||||||
Impairment of intangible assets | - | - | - | - | - | - | - | 6.3 | ||||||||||||||||
Transaction-related costs | - | - | - | - | - | - | 48.8 | - | ||||||||||||||||
Adjusted EBITDA 1 | 41.9 | 38.5 | 76.5 | 23.2 | 38.2 | 31.7 | 52.0 | 52.4 | ||||||||||||||||
__________________________________________________ |
1 Fiscal Year 2018 includes disposals of £1.9. |
For additional information on SBG's non-IFRS measures, see below under "Non-IFRS Measures" and "Key Metrics and Other Data".
The Stars Group has not provided a reconciliation of the non-IFRS measures to the nearest IFRS measures included in its full year 2018 financial guidance or full year 2018 pro forma financial guidance provided in this news release, including Adjusted EBITDA, Adjusted Net Earnings and Adjusted Diluted Net Earnings per Share, because certain reconciling items necessary to accurately project such IFRS measures, particularly net earnings (loss), cannot be reasonably projected due to a number of factors, including variability from potential foreign exchange fluctuations impacting financial expenses, and the nature of other non-recurring or one-time costs (which are excluded from non-IFRS measures but included in net earnings (loss)), as well as the typical variability arising from the audit of annual financial statements, including, without limitation, certain income tax provision accounting, and related accounting matters.
Categoría:Gaming
Tags: Sin tags
País: Canada


Event


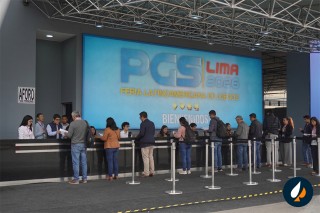
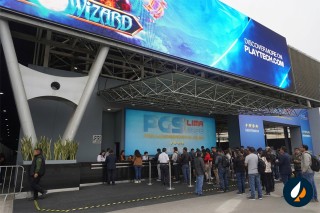
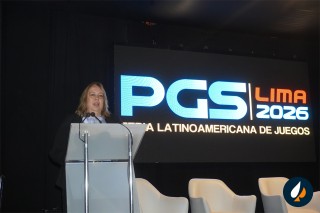


PERU GAMING SHOW – PGS 2026
17 de June 2026
Reusable Identity and Smoother Access: JUMIO’s Approach at Peru Gaming Show 2026
(Lima, SoloAzar Exclusive).- Peru Gaming Show (PGS) 2026 hosted the conference “Reusable Identity: Less Friction, More Play – How to Simplify Player Access,” led by Pilar Pereira, Director of Strategic Alliances at JUMIO. She explained how the evolution of digital identity is transforming user experiences on online betting platforms amid strong global growth in the sector.
Friday 03 Jul 2026 / 12:00
Andres Troelsen: "Peru remains one of EGT Digital's strategic markets in LATAM"
(Lima, SoloAzar Exclusive).- Following his participation in the Peru Gaming Show, Andres Troelsen, Regional Sales Director LATAM of EGT Digital, reflects on the company's priorities in the region, the evolving demands of operators, and the opportunities emerging across the Latin American gaming market for EGT Digital.
Friday 03 Jul 2026 / 12:00
Gaming Taxation in Latin America: Experts Warn of Excessive Levies
(Lima, SoloAzar Exclusive).- As part of the Peru Gaming Show (PGS) 2026, the panel “Taxation: Gaming Taxes in Latin America” brought together leading specialists to analyze the fiscal challenges facing the gaming industry in the region. Moderated by Carlos Fonseca, the discussion featured Tomás García Botta (MF Estudio) and Carlos Baeza (Baeza & Cía.). The experts agreed that excessive tax burdens not only discourage investment but also reduce channeling toward the regulated market and foster the growth of illegal offerings in various Latin American countries.
Wednesday 01 Jul 2026 / 12:00
SUSCRIBIRSE
Para suscribirse a nuestro newsletter, complete sus datos
Reciba todo el contenido más reciente en su correo electrónico varias veces al mes.