AGS Announces Third Quarter 2018 Results
⏱ 6 min read
(Las Vegas).- Record Quarterly Revenue of $75.5 Million Grew 34% Year-Over-Year- Total Adjusted EBITDA (non-GAAP) of $33.6 Million Grew 14% Year-Over-Year- Record Net Income Improved to $4.3 Million- Record EGM Units Sold of 1,332 Grew 58% Year-Over-Year
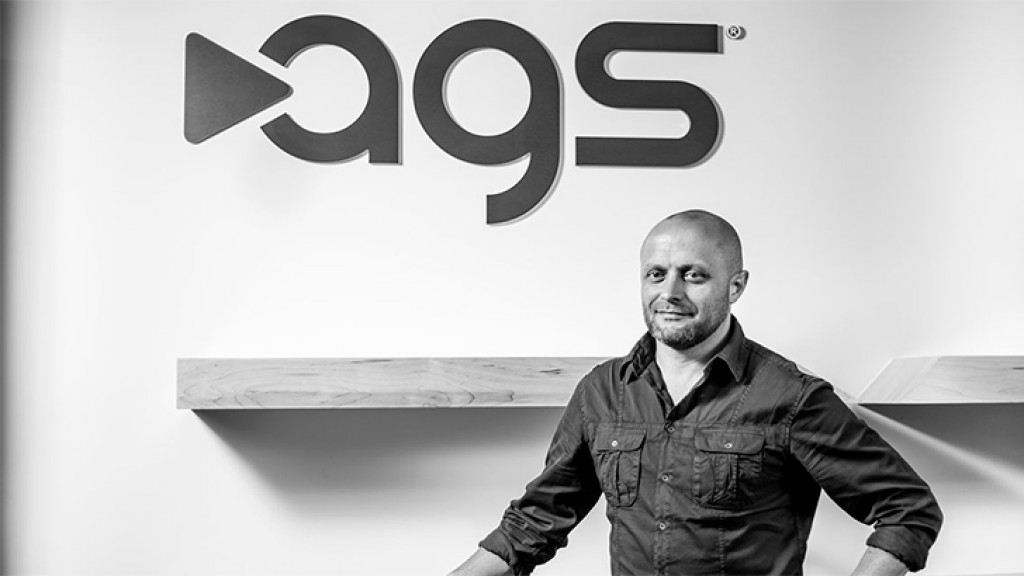
AGS President and Chief Executive Officer David Lopez said, "In the third quarter, AGS sold 1,332 EGMs, a 58% jump year-over-year, and a company record. Revenue hit an all-time high of $75.5 million, demonstrating continued demand for our Orion Portrait cabinet and growing momentum for our new Orion Slant, in addition to significant progress in Canada, with 24% of our sold EGMs placed in several Canadian provinces. Our Tables segment posted its best quarter to date, with our innovative progressives contributing to a 30% increase in installs year-over-year. AGS is still very underrepresented in many markets both domestically and internationally, which presents significant long-term growth opportunities for the Company due to our industry-leading game performance, an expanding suite of cabinet options, best-in-class R&D, and diversified product offerings."
Summary of the quarter ended September 30, 2018 and 2017 | |||||
(In thousands, except per-share and unit data) | |||||
Three Months Ended September 30, | |||||
2018 | 2017 | % Change | |||
Revenues | |||||
EGM | $ | 71,784 | $ | 53,331 | 34.6 % |
Table Products | 2,052 | 1,099 | 86.7 % | ||
Interactive | 1,690 | 2,010 | (15.9)% | ||
Total revenue | $ | 75,526 | $ | 56,440 | 33.8 % |
Operating income | $ | 10,110 | $ | 9,136 | 10.7 % |
Net income (loss) | $ | 4,347 | $ | (4,090) | N/A |
Income (loss) per share | $ | 0.12 | $ | (0.18) | N/A |
Adjusted EBITDA | |||||
EGM | $ | 34,026 | $ | 29,756 | 14.4 % |
Table Products | 428 | (232) | N/A | ||
Interactive | (877) | (123) | N/A | ||
Total Adjusted EBITDA(1) | $ | 33,577 | $ | 29,401 | 14.2 % |
EGM units sold | 1,332 | 842 | 58.2 % | ||
EGM total installed base, end of period | 24,184 | 22,015 | 9.9 % | ||
(1) Total Adjusted EBITDA is a non-GAAP measure, see non-GAAP reconciliation below. |
Third Quarter Financial Highlights
- Total revenue increased 34% to $75.5 million, a Company record, driven by continued growth of our EGMs in the Class III marketplace, including entry into Alberta, Canada as well as a large sale to a long-standing tribal customer.
- Recurring revenue grew to $50.7 million, or 18% year-over-year. In addition to the contribution from the EGMs purchased from Rocket Gaming, the increase was driven by our strong domestic revenue per day ("RPD") of $27.14, up $1.70 year-over-year as well as increases in Table Products revenue driven by an increase in Table Product units.
- EGM equipment sales increased 82% to $24.7 million, another Company record, due to the sale of 1,332 units, of which approximately 24% were sold in Canada and 276 units were sold to a long-standing tribal customer.
- Net income improved to $4.3 million from a net loss of $4.1 million in the prior year period, primarily due to the increased revenue described above.
- Total Adjusted EBITDA (non-GAAP) increased to $33.6 million, or 14%, driven by the significant increase in revenue, partially offset by increased adjusted operating expenses of $6.1 million primarily due to increased headcount in SG&A and R&D. Included in that amount was approximately $1.0 million of operating costs from our recently acquired real money gaming ("RMG") content-aggregator Gameiom.(1)
- Total Adjusted EBITDA margin (non-GAAP) decreased to 44% in the third quarter of 2018 compared to 52% in the prior year driven by several different factors, most notably the increased proportion of equipment sales as part of total revenues, higher-period costs related to manufacturing, and service costs,as well as increased operating costs mentioned above and costs associated with our recently acquired RMG content-aggregator Gameiom.(1)
- SG&A expenses increased $5.5 million in the third quarter of 2018 primarily due to increased salary and benefit costs of $2.8 million due to higher headcount, and $2.2 million from increased professional fees driven by acquisitions as well as previous securities offerings. The increase was also attributable to costs associated with the recent acquisition of RMG content-aggregator Gameiom.
- R&D expenses increased $1.4 million in the third quarter of 2018 driven by higher salary and benefit costs related to additional headcount. As a percentage of total revenue, R&D expense was 10% for the period ended September 30, 2018 compared to 11% for the prior year period.
(1) Adjusted EBITDA is a non-GAAP measure, see non-GAAP reconciliation below.
Third Quarter Business Highlights
- EGM units sold increased to 1,332, a Company record, in the current quarter compared to 842 in the prior year led by sales of the Orion Portrait and Orion Slant cabinets in early-entry markets such as Alberta, Nevada, and Ontario.
- Domestic EGM RPD increased 7% to $27.14, driven by our new product offerings and the optimization of our installed base by installing our newer higher-performing EGMs.
- EGM average selling price ("ASP") increased 14% to $18,051, driven by record sales of the premium-priced Orion Portrait cabinet and our newly introduced core-plus cabinet, Orion Slant.
- Table Products increased 328 units sequentially, or 12%, to 3,065 units, driven by organic growth, most notably the Super 4 Progressive Blackjack and Buster Blackjack side bet.
- Our ICON cabinet footprint grew 59% year over year to over 6,800 total units in the field.
- Mexico's installed base increased 645 units year over year and 240 units sequentially to over 8,100 units with over 420 ICON units as of September 30, 2018.
- The Orion Portrait cabinet ended the third quarter of 2018 with a footprint of over 4,460 total units as compared to 1,123 units in the third quarter of 2017, up 134% from year-end and 298% year-over-year.
- AGS' new Orion Slant footprint increased to over 780 units by quarter end.
Balance Sheet Review
Capital expenditures increased $5.6 million to $16.1 million in the third quarter, compared to $10.5 million in the prior year period. As of September 30, 2018, we had $33.2 million in cash and cash equivalents, compared to $19.2 million at December 31, 2017. Total net debt, which is the principal amount of debt outstanding less cash and cash equivalents, as of September 30, 2018, was approximately $476.9 million compared to $648.7 million at December 31, 2017. This substantial reduction was driven by the IPO and related redemption of our HoldCo PIK notes during the first quarter. In the third quarter, net debt decreased by over $6.9 million due to mandatory principal payments on our term loans and a higher balance of cash and cash equivalents. As a result of the above transactions and our strong operational performance, our total net debt leverage ratio, which is total net debt divided by Adjusted EBITDA for the trailing 12-month period, decreased from 6.1 times at December 31, 2017, to 3.6 times at September 30, 2018.(2)
(2) Total net debt leverage ratio is a non-GAAP measure, see non-GAAP reconciliation below.
Term Loan Repricing
On October 5, 2018, we entered into an Incremental Assumption and Amendment Agreement No. 2 to reduce the applicable interest rate margin for the Term B Loans by 75 basis point from LIBOR plus 425 bps to LIBOR plus 350 bps, saving nearly $4 million in annual cash interest expense, with an additional 25 basis points potential reduction upon receiving a corporate credit rating of at least B1 from Moody's Investors Service. In conjunction with the repricing, we secured commitments from lenders for an additional $30 million in terms loans under our existing credit agreement. The net proceeds of the incremental term loans are expected to be used for general corporate purposes and additional capital to accelerate growth.
2018 Outlook
Based on our year-to-date progress and due to our current momentum, we now expect our total Adjusted EBITDA in 2018 to be between $134.0 and $136.0 million. This is an upward revision to the guidance we previously released and is based on our progress executing against our many growth initiatives in the first half of the year and due to our improved visibility for the remainder of the year.
We have not provided a reconciliation of forward-looking total Adjusted EBITDA to the most directly comparable GAAP financial measure, net income (loss), due primarily to the variability and difficulty in making accurate forecasts and projections of the variable and individual adjustments for a reconciliation to net income (loss), as not all of the information necessary for a quantitative reconciliation is available to us without unreasonable effort. We expect that the main components of net income (loss) for fiscal year 2018 shall consist of operating expenses, interest expenses, as well as other expenses (income) and income tax expenses, which are inherently difficult to forecast and quantify with reasonable accuracy without unreasonable efforts. The amounts associated with these items have historically and may continue to vary significantly from quarter to quarter and material changes to these items could have a significant effect on our future GAAP results.
Conference Call and Webcast
Today at 5 p.m. EST management will host a conference call to present the third quarter 2018 results. Listeners may access a live webcast of the conference call, along with accompanying slides, at AGS' Investor Relations website at http:// investors.playags.com. A replay of the webcast will be available on the website following the live event. To listen by telephone, the U.S/Canada toll-free dial-in number is +1 (866) 270-1533 and the dial-in number for participants outside the U.S./Canada is +1 (412) 317-0797. The conference ID/confirmation code is AGS Q3 2018 Earnings Call.
Categoría:Gaming
Tags: AGS, AGS President and Chief Executive Officer David Lopez,
País: United States


Event

PERU GAMING SHOW – PGS 2026
17 de June 2026
Enhancing Responsible Gaming Through Effective Training at PGS 2026
(Lima, SoloAzar Exclusive) – Training, prevention, and technology took center stage at the "Value of Responsible Gaming in Gambling Operations" conference during the 2026 Perú Gaming Show (PGS). Presented by Fernando Calderón Castro, President of the National Gaming Society (SONAJA), the session brought industry leaders together to tackle current challenges and explore strategies for safer, more transparent, and sustainable operations.
Wednesday 22 Jul 2026 / 12:00
LSports at the Peru Gaming Show: Building Presence, Opening Doors
(Lima, SoloAzar Exclusive).- The Peru Gaming Show was never just about the booth. For LSports, it was about showing up in a market where showing up still matters — and leaving with more than a contact list. Federico Brancato, Sales Manager for the LATAM Region, came to Lima with a clear sense of what operators in this part of Latin America need most right now. What he found confirmed it.
Friday 17 Jul 2026 / 12:00
Martin Ivanov: "Latin America remains one of CT Interactive's key strategic regions"
(Lima, SoloAzar Exclusive).- CT Interactive Chief Operating Officer Martin Ivanov reflects on the company's experience at the Peru Gaming Show, highlights the opportunities emerging in the Peruvian market, and outlines the company's strategic priorities for expanding across Latin America.
Thursday 16 Jul 2026 / 12:00
SUSCRIBIRSE
Para suscribirse a nuestro newsletter, complete sus datos
Reciba todo el contenido más reciente en su correo electrónico varias veces al mes.