U.S. Commercial Gaming Revenue Hits $19.44B in Q2 2025, Up 9.8% YoY, AGA reports
Monday 25 de August 2025 / 12:00
⏱ 4 min read
(Washington DC).- The Commercial Gaming Revenue Tracker from the American Gaming Association (AGA) offers detailed financial insights into the U.S. commercial gaming sector at both national and state levels, drawing from official state regulatory data. The latest edition focuses on performance outcomes for Q2 2025.
The American Gaming Association’s (AGA) Commercial Gaming Revenue Tracker provides national and state level insight into the U.S. commercial gaming industry’s financial performance based on state regulatory reports. This report highlights results for the second quarter of 2025.
This report highlights results for the second quarter of 2025.
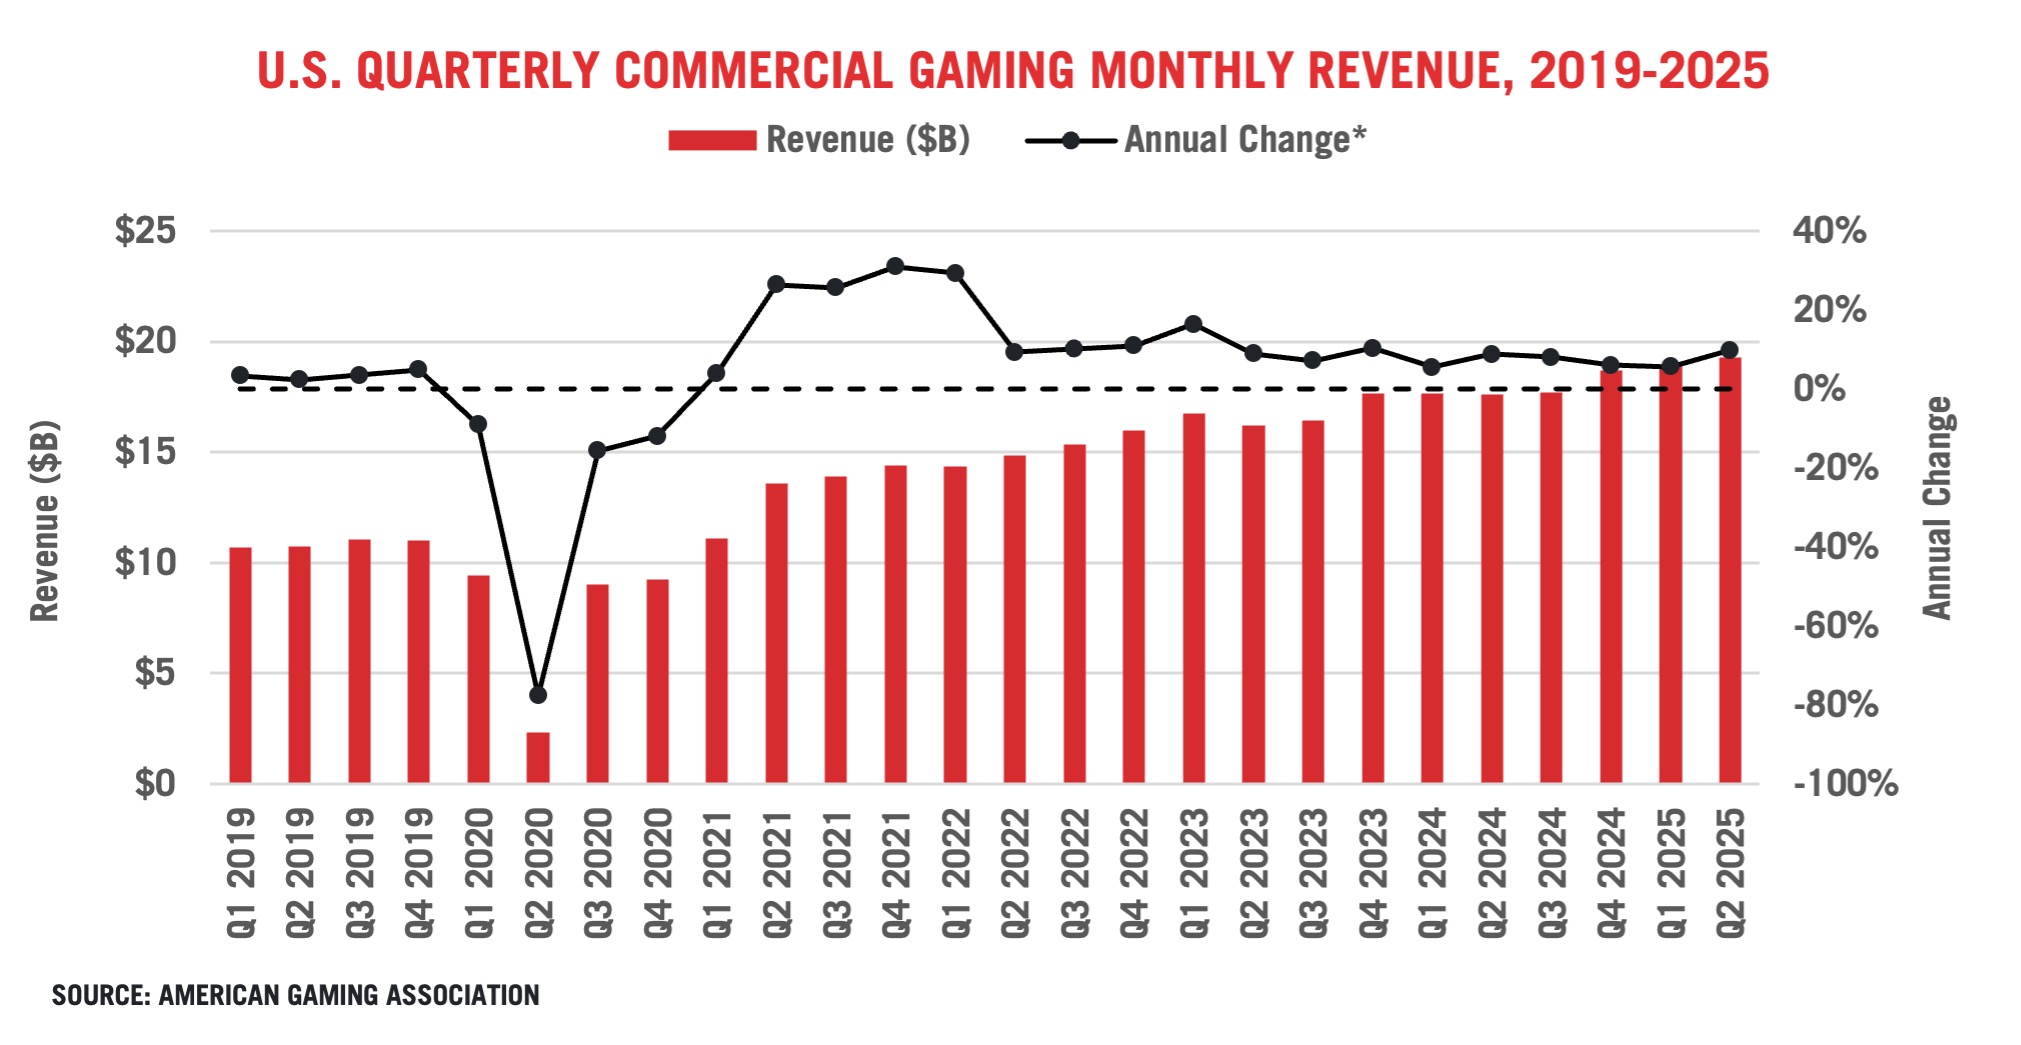
Commercial Gaming Revenue Growth Accelerates in Q2
U.S. commercial gaming revenue growth accelerated in the second quarter with continued growth across all verticals.
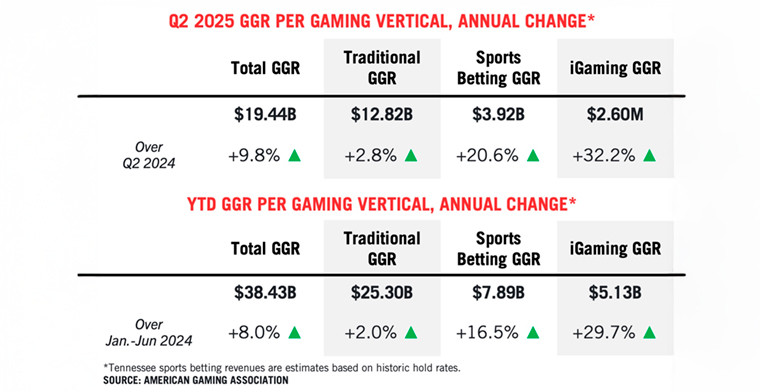
Data compiled by the American Gaming Association (AGA) from state regulatory disclosures shows that combined revenue from commercially operated land-based casinos, sports betting, and iGaming increased by 9.8 percent year-over-year, reaching $19.44 billion for the quarter.
Q2 was the industry’s eighteenth consecutive quarter of year-over-year growth and its highest-grossing Q2 revenue performance on record.
Total June revenue expanded 12.8 percent over the previous year, with growth in traditional casino (+2.4%), iGaming (+31.1%) and sports betting (+39.5%) generating monthly revenue of $6.40 billion.
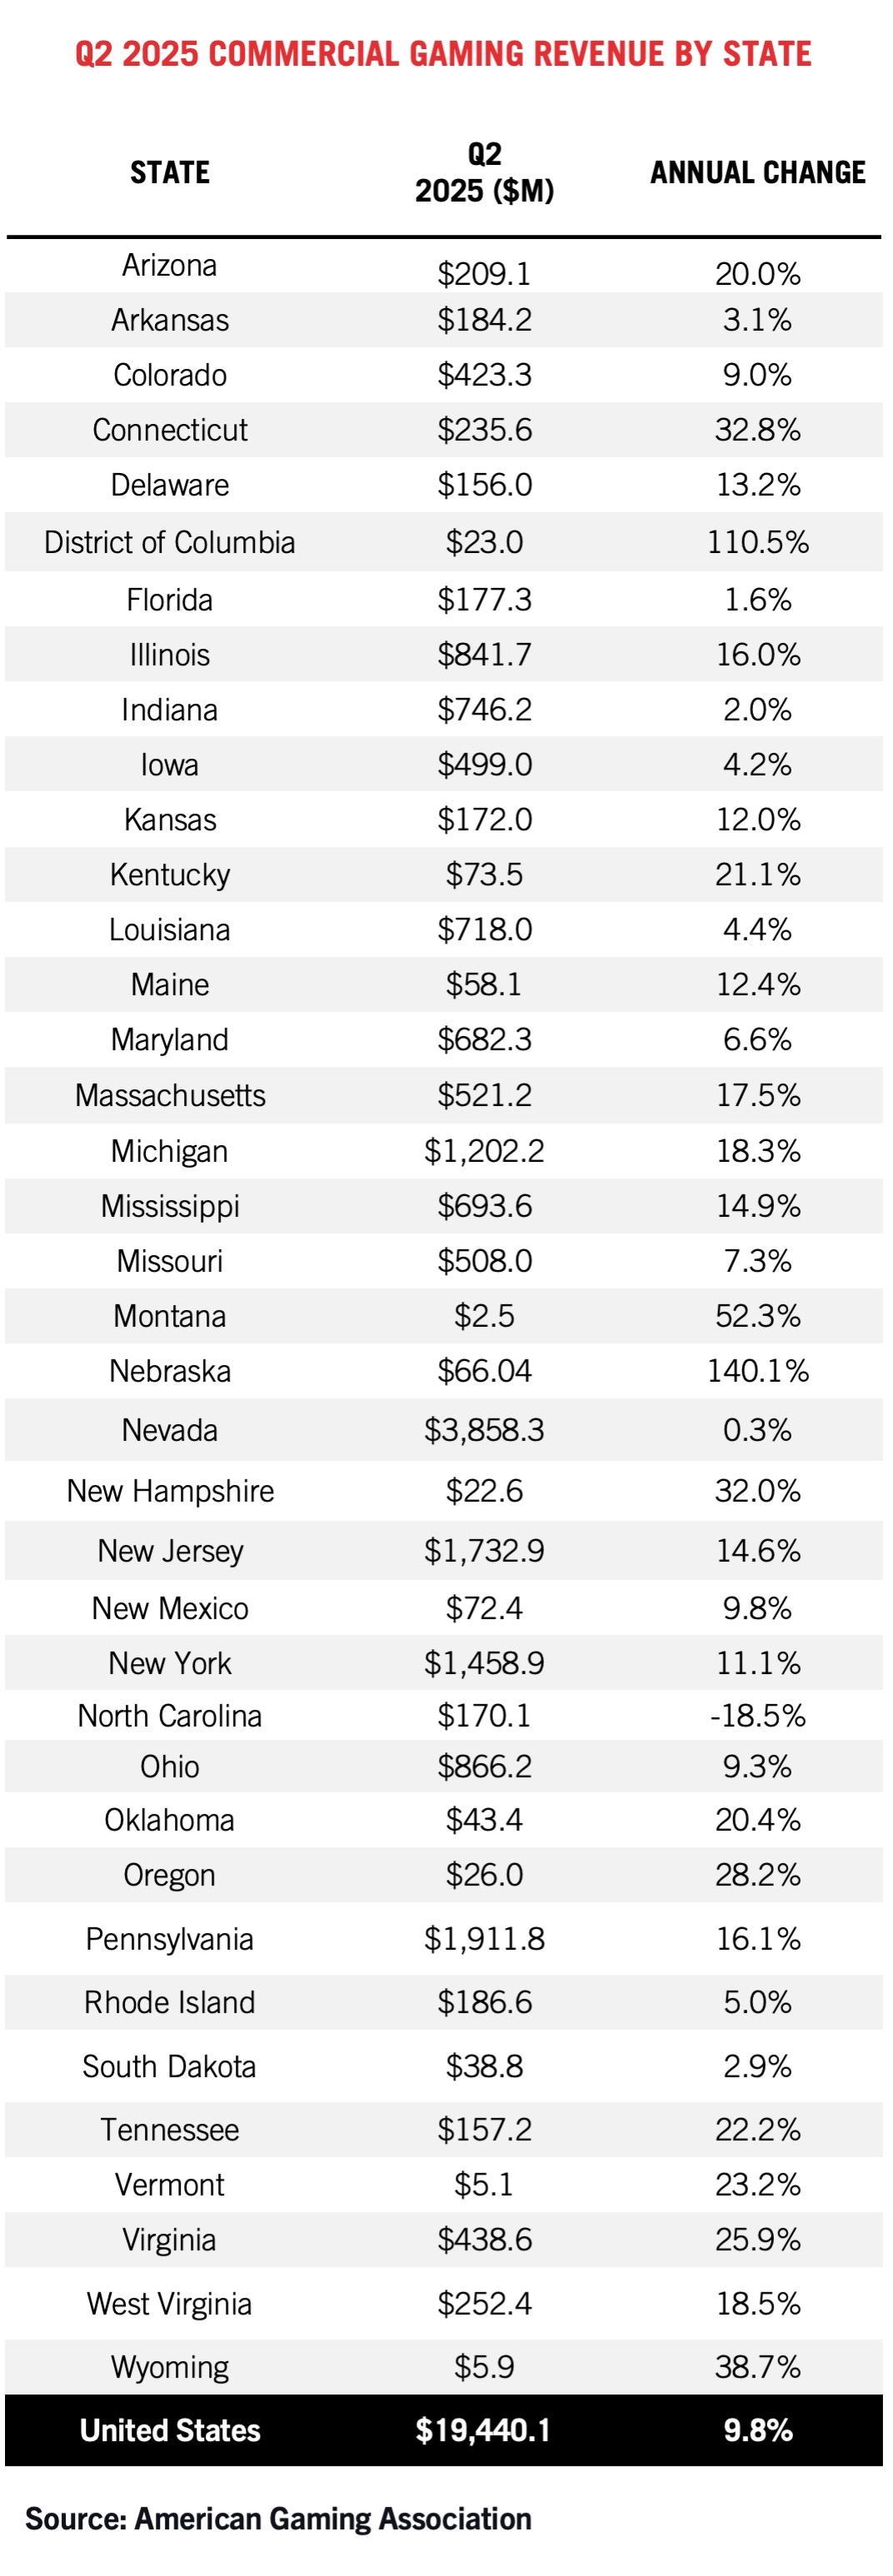
Nearly All States See Rising Q2 Revenue
Out of the 38 operational commercial gaming jurisdictions with complete data available through June 37 increased second quarter revenue compared to 2024.
North Carolina is the only state with a Q2 revenue decline, contracting 18.5% due to a weak April compared to 2024 when March Madness games featured Duke, NC State, and UNC games drove a higher revenue comparison.
$4.59 Billion in Gaming Taxes Bolster State and Local Governments
State and local governments in gaming states saw a record influx of direct gaming taxes in the second quarter. Commercial gaming operators paid an estimated $4.59 billion in Q2 gaming taxes, an increase of 18.8 percent year-over-year.
Note that these gaming tax figures only cover specific state and local taxes directly linked to gaming revenue that are reported monthly or quarterly. Fees that are levied on an annual basis are not covered, nor are sports betting excise tax payments to the federal government. The figures also do not encompass the billions of additional tax dollars paid by industry on income, sales, payroll or various corporate taxes.
Brick & Mortar Revenue 2/3 of Commercial Industry
The U.S. commercial gaming industry realized year-over-year growth across land-based and online gaming in Q2.
Quarterly revenue from land-based gaming – comprising casino slots, table games and retail sports betting – totaled $12.93 billion, 2.8 percent higher than Q2 2024.
Meanwhile, online gaming revenue growth – comprising iGaming and online sports betting – increased 24.2 percent year-over-year compared to 15.3 percent in Q1, driven largely by online sports betting and pushed by strong June performance.
Combined revenue from online sports betting and iGaming was $6.44 billion in Q2 as online gaming made up 33.2% of commercial gaming revenue, in line with the past few quarters.
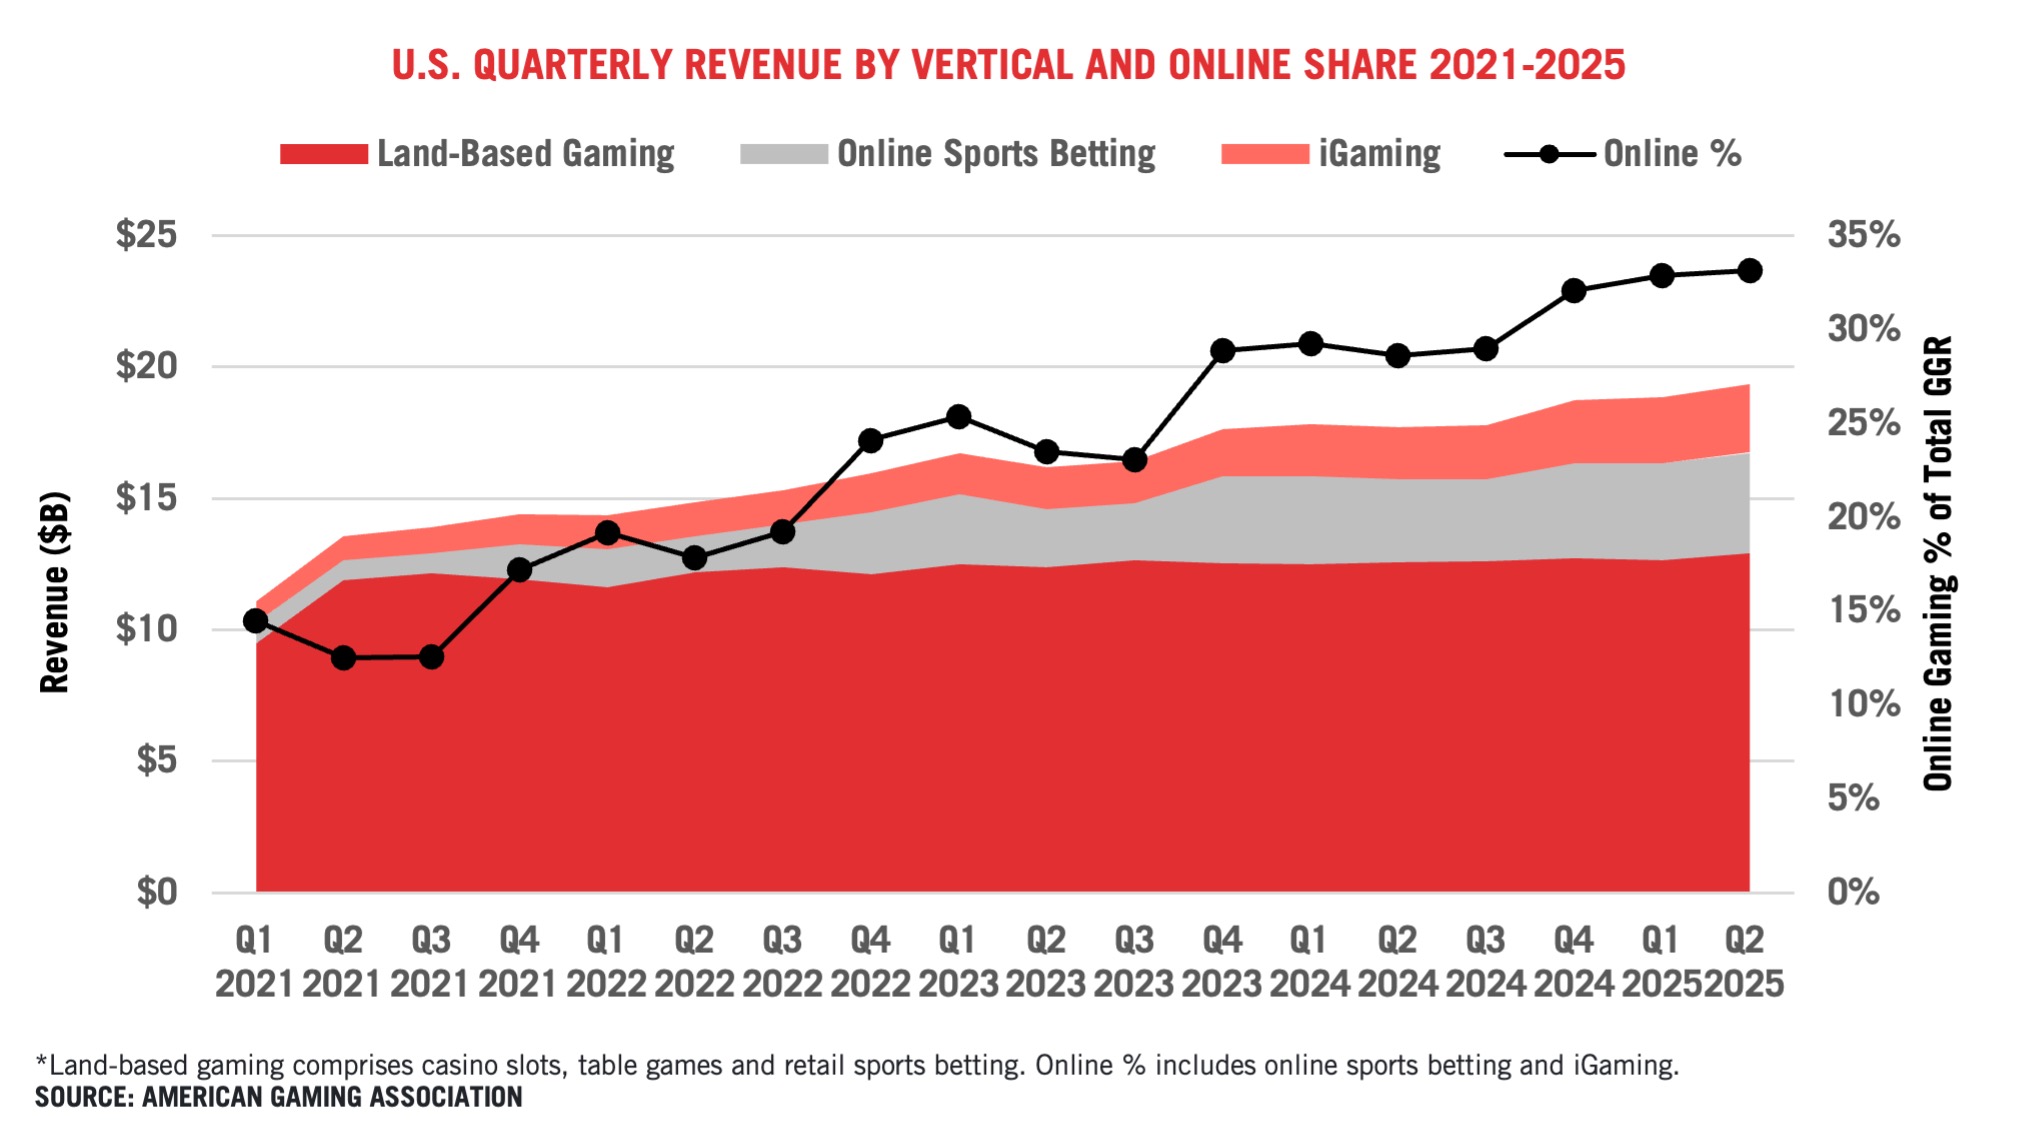
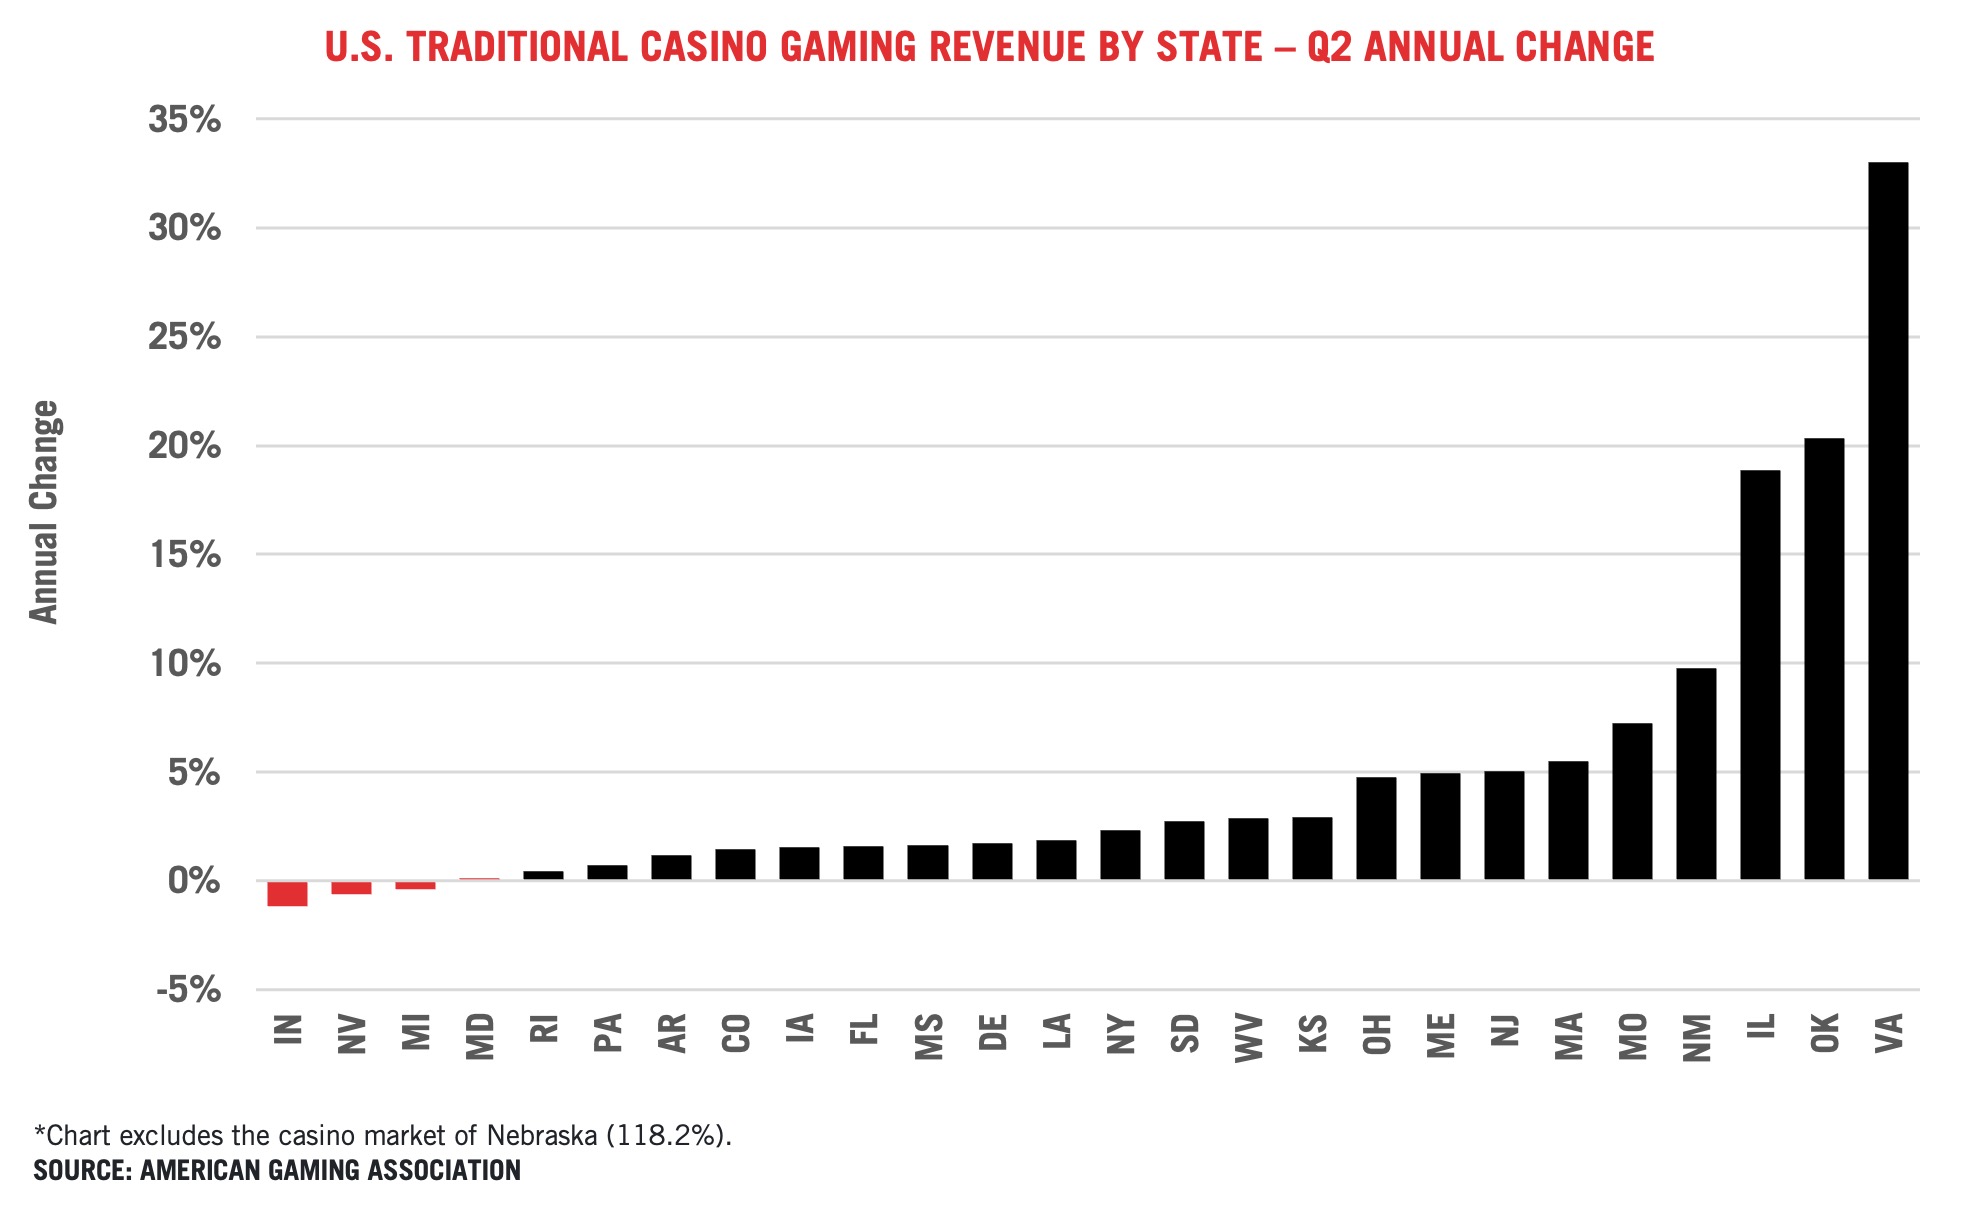
Table and Slot Games See Year over Year increase in Q2
Traditional brick-and-mortar casino gaming revenue expanded by 2.8 percent in the second quarter, with slot machines and table games generating $12.83 billion in revenue. Brick and mortar revenue increased year-over-year in all three months in Q2.
Nationwide, casino slot machines generated $9.37 billion in Q2, up 3.6 percent from the previous year, while table games produced $2.53 billion, up fractionally year-over-year. The separate slot and table game figures do not include data from Louisiana and Michigan, where traditional casino gaming data is reported in aggregate rather than as separate verticals.
At the state market level, 24 of 27 markets posting traditional casino revenue increases compared to the prior year. Virginia (+33.0%) Oklahoma (+20.4%) and Illinois (+18.9%) each posted strong growth with Virginia and Illinois continuing to benefit from relatively recent expansion while Oklahoma benefited from a weak 2024 comparison when Will Rodgers Downs was shuttered due to storm damage.
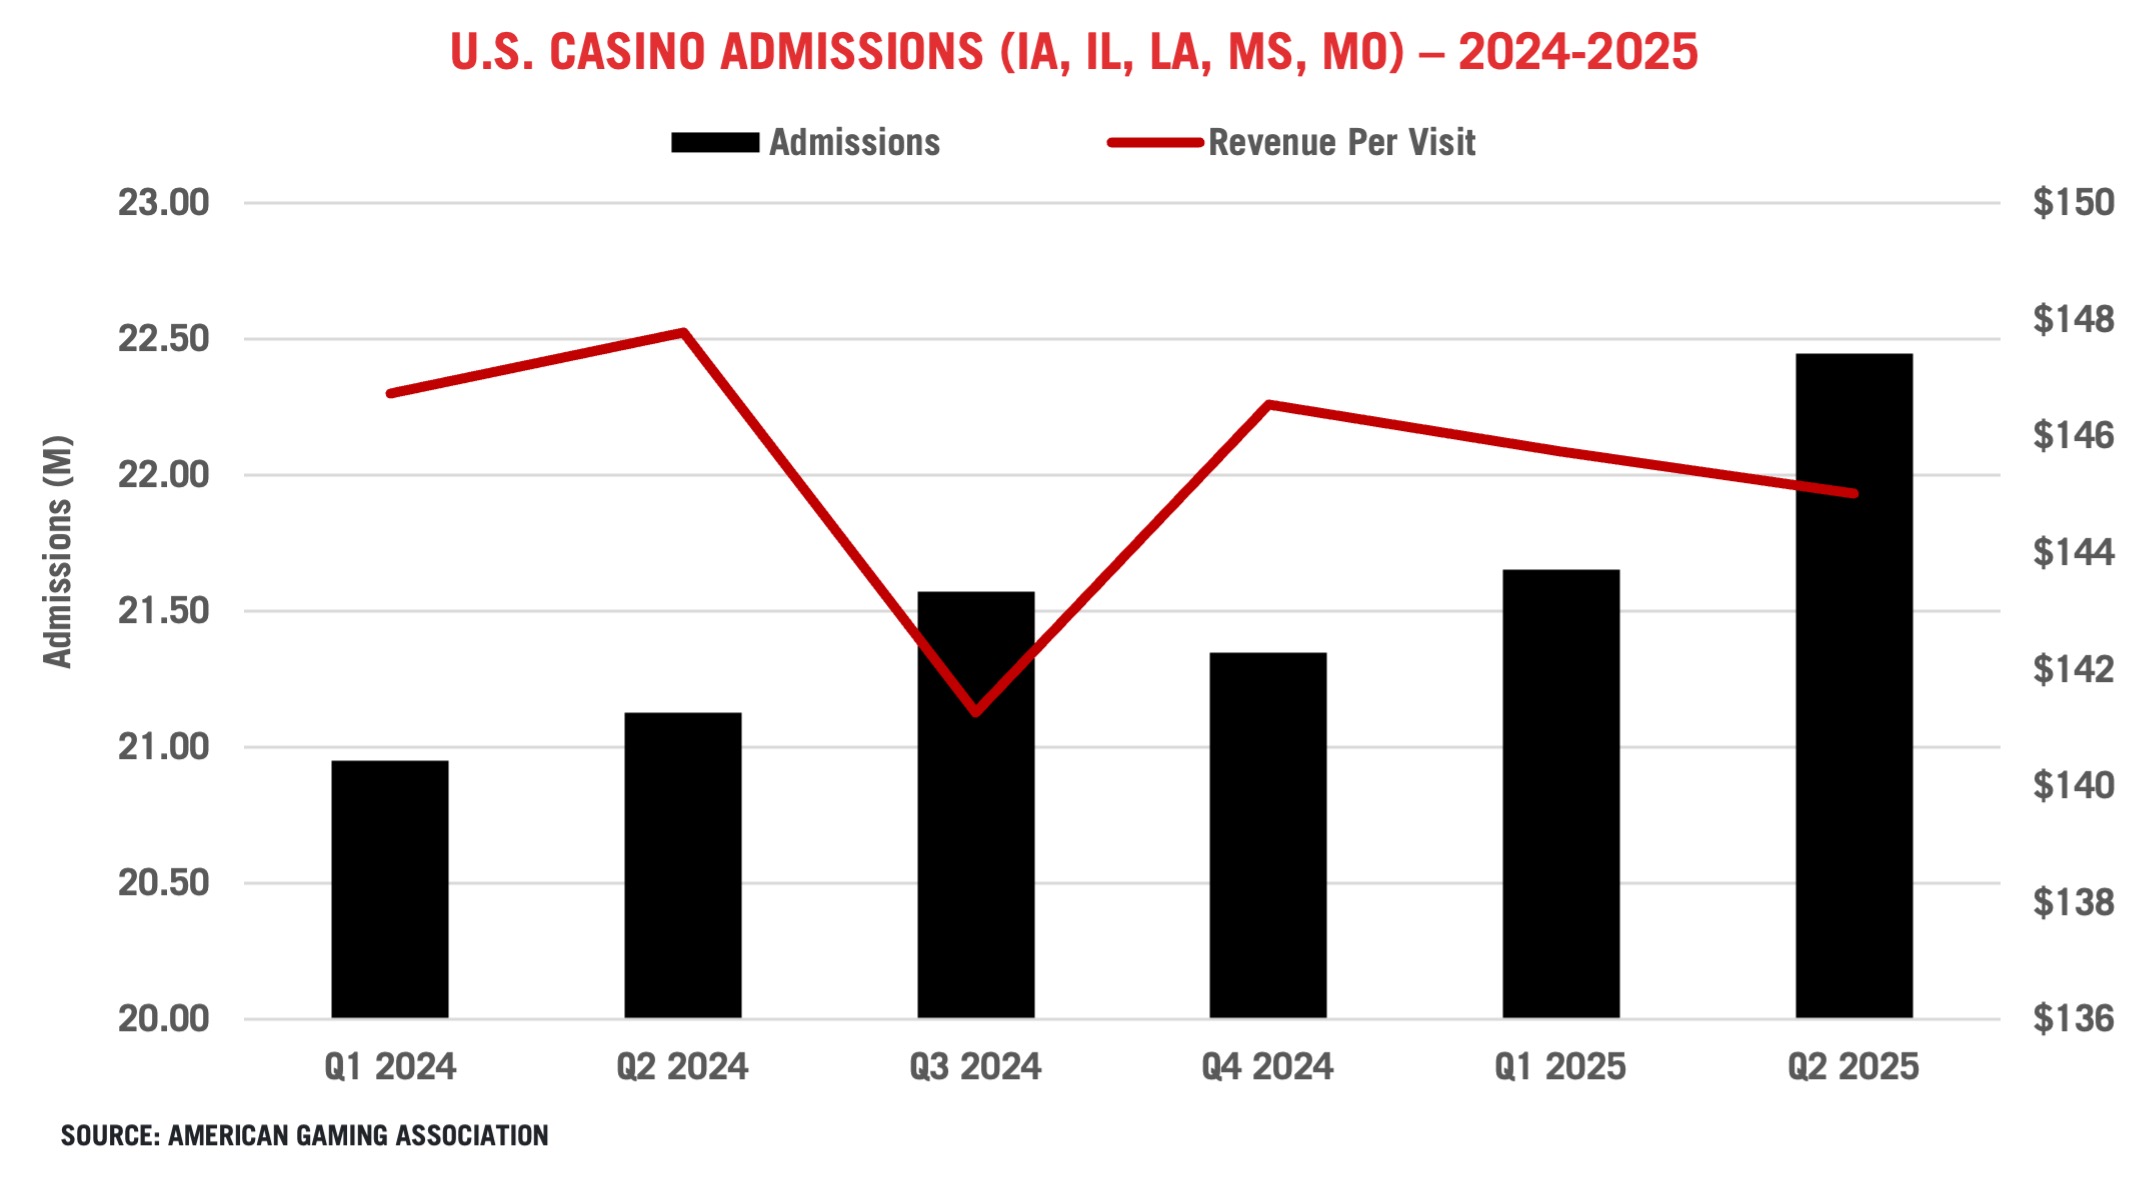
Admission Numbers Decrease
Admissions numbers in five states that track them for brick-and-mortar casinos increased 6.3% in the second quarter compared to last year while revenue per visit fell 1.9%.
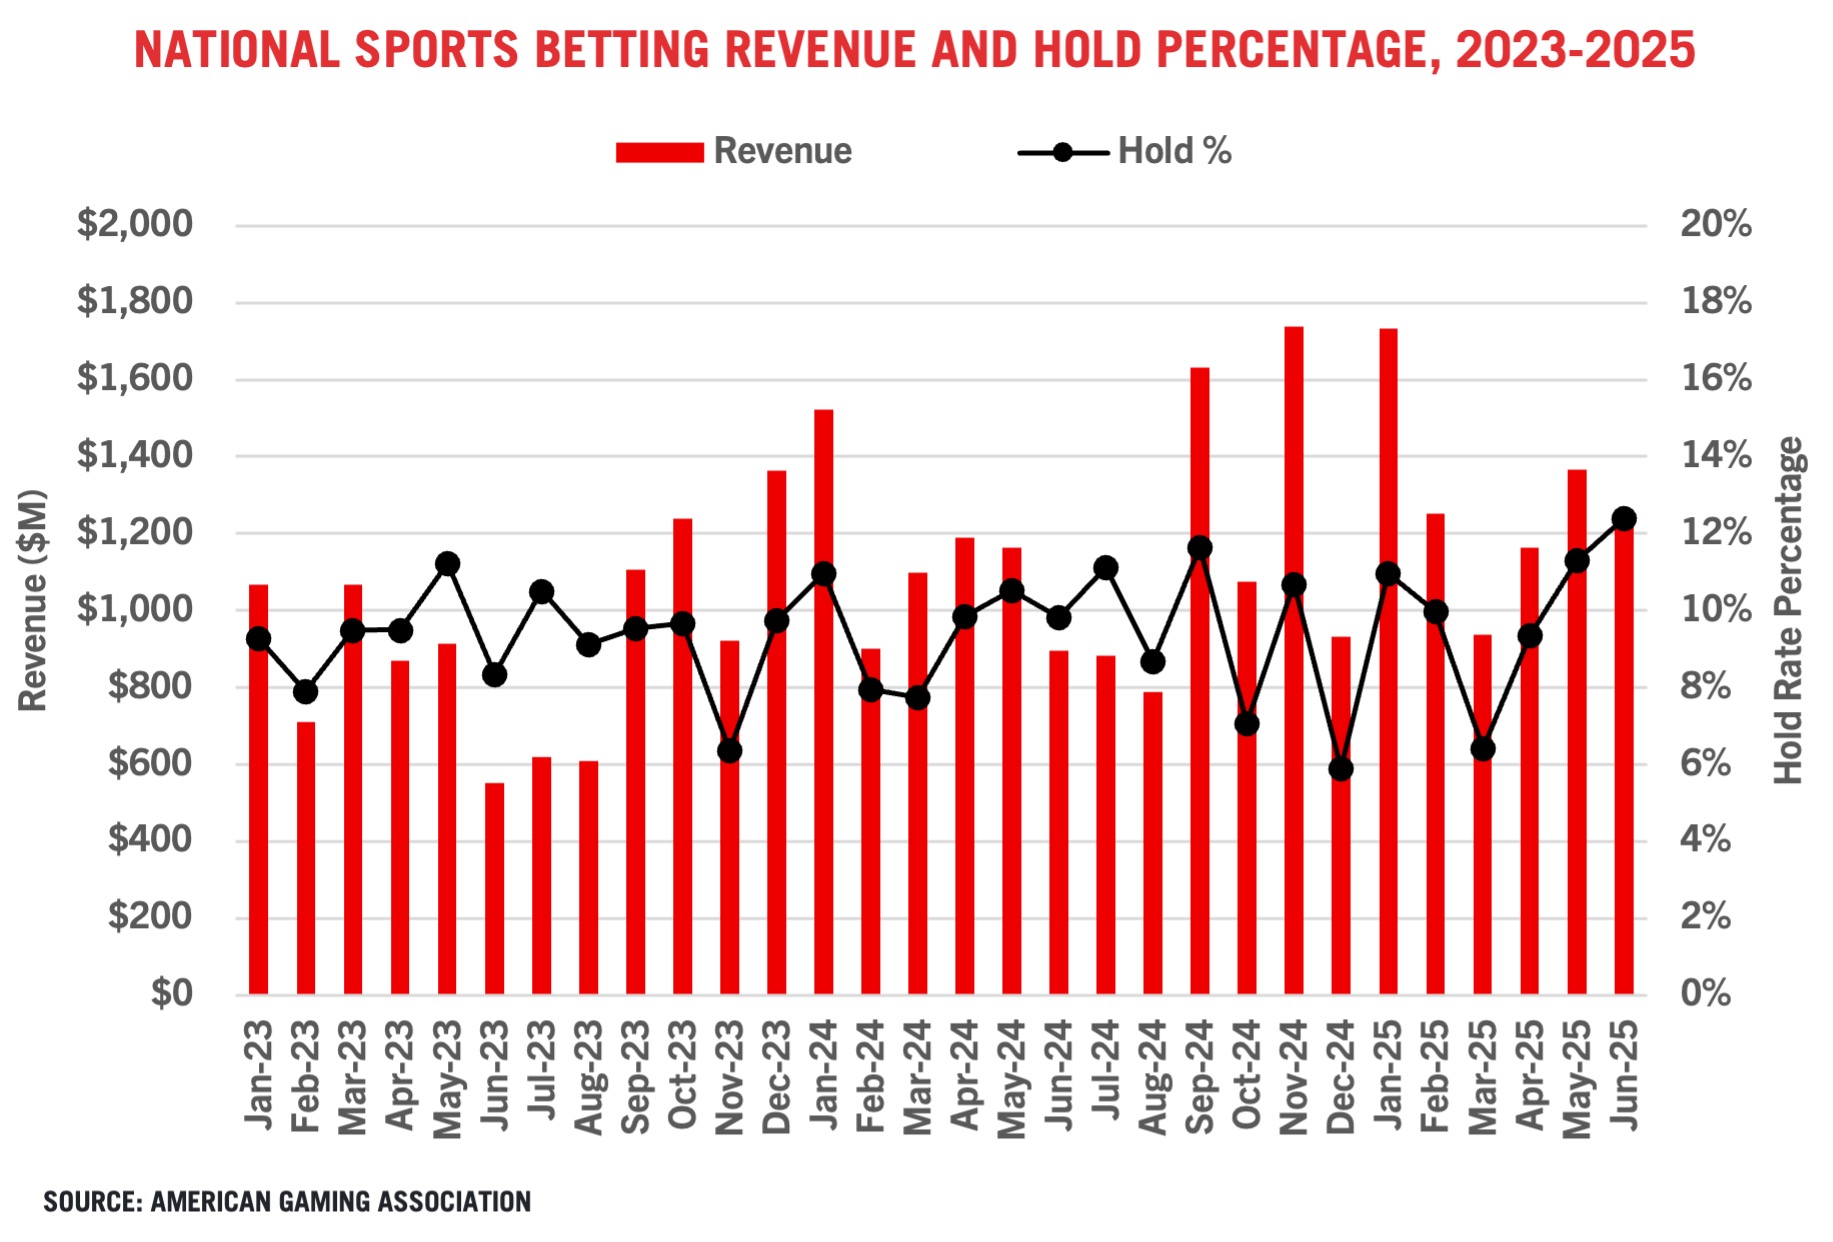
Sports Betting Expands with Strong June Performance
Second quarter sports betting revenue grew 20.6 percent to $3.92 billion, a second-quarter revenue record. June revenue expanded 39.5 percent with all 34 reporting states seeing a year-over-year increase.
Second quarter commercial sports betting handle increased 11.7 percent as Americans wagered $36.05 billion on sports from April through June. Second quarter sports betting hold increased 80 basis points, to 10.87 percent from 10.07 percent last year. Year to date, the sports betting hold rate was 9.9 percent, up 43 basis points over the same period last year.
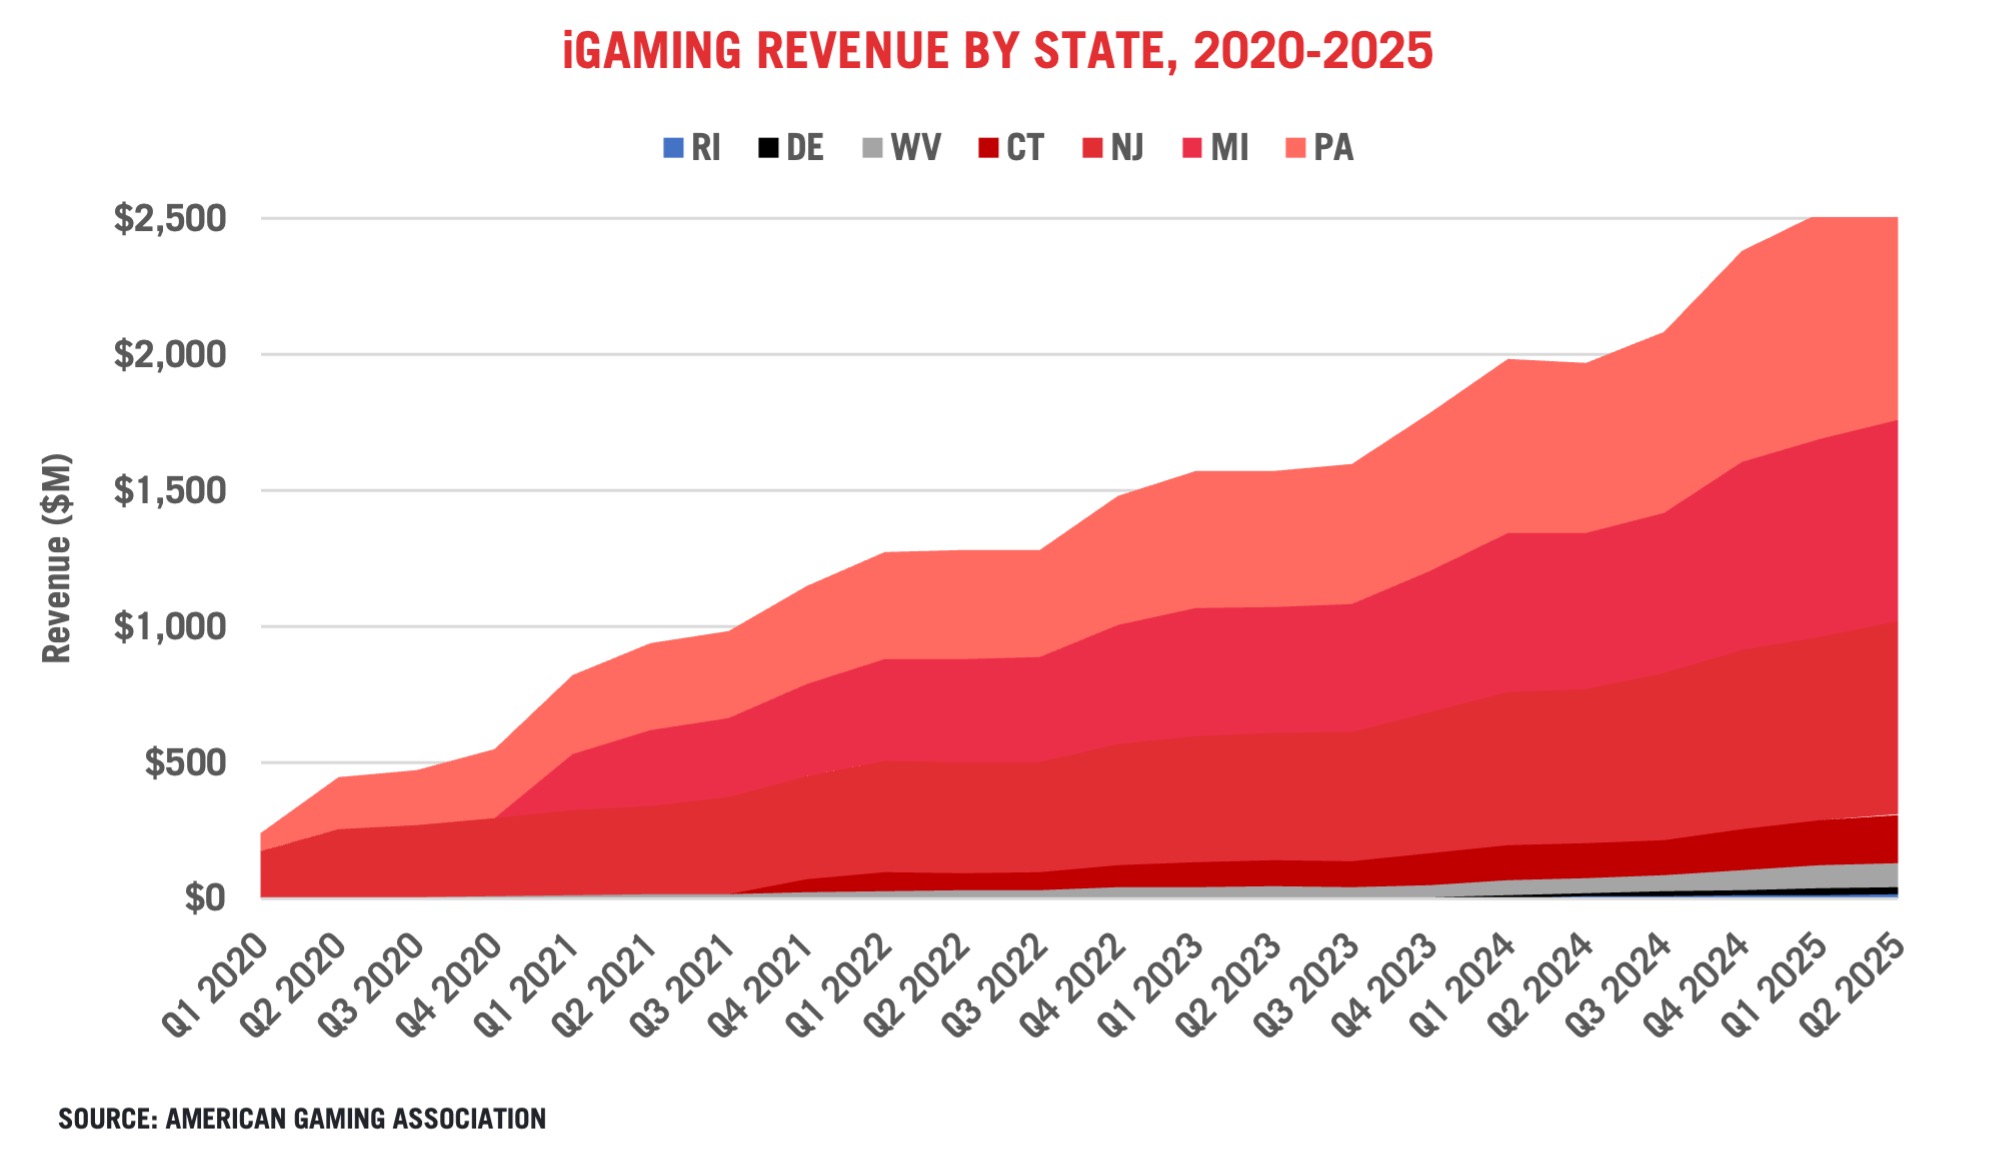
iGaming Revenue Continues Expansion
iGaming revenue growth remained strong in the second quarter, generating $2.60 billion of revenue across seven states, up 32.2 percent over the second quarter of last year.
Each of the seven iGaming states grew year-over-year in the second quarter, led by 116.6 percent growth in Rhode Island. Notably, through June, New Jersey iGaming revenue eclipsed brick-and-mortar casino revenue and the two verticals are nearly equal in Pennsylvania.
Year-to-date through June, national iGaming revenue stands at $5.13B, 29.7 percent higher than the same period last year.
About the Report
AGA’s Commercial Gaming Revenue Tracker provides state-by-state and nationwide insight into the U.S. commercial gaming industry’s financial performance. Monthly updates on AmericanGaming.org feature topline figures based on state revenue reports while quarterly reports provide a more detailed analysis covering the three previous months.
Categoría:Reports & Data
Tags: Sin tags
País: United States
Región: North America


Event


SBC Summit Americas 2026
09 de June 2026
Driving Player Engagement: EGT Digital's Insights from SBC Summit Americas
(Fort Lauderdale, SoloAzar Exclusive).- SBC Summit Americas offered EGT Digital an excellent platform to strengthen existing relationships and engage directly with the LATAM market. Learn more in the following interview with Andres Troelsen, Regional Sales Director LATAM.
Monday 22 Jun 2026 / 12:00
Sportradar’s Eduardo Lobato about SBC Summit Americas: "this year's edition was particularly special"
(Fort Lauderdale, Florida, SoloAzar Exclusive).- In an interview following SBC Summit Americas, Eduardo Lobato, Enterprise Client Partner Lead at Sportradar, shares his insights on the industry's evolving priorities, the impact of the FIFA World Cup atmosphere on the event, and why AI-powered personalization is becoming essential for long-term success in Latin America's betting market.
Monday 22 Jun 2026 / 12:00
SBC Summit Americas 2026: A Hub for Networking and Collaboration
(Fort Lauderdale).- Held at the Broward County Convention Center from June 9-11, SBC Summit Americas facilitated discussions between operators, affiliates, suppliers and regulators on the opportunities and challenges shaping gaming markets across the Americas.
Friday 19 Jun 2026 / 12:00
SUSCRIBIRSE
Para suscribirse a nuestro newsletter, complete sus datos
Reciba todo el contenido más reciente en su correo electrónico varias veces al mes.